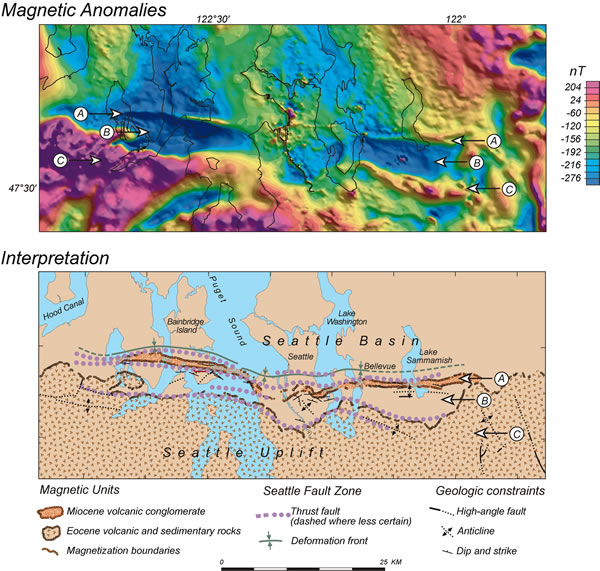
Figure 5.
Example of using magnetic anomalies to map subsurface lithologies. A, B, and C on top map indicate sinuous magnetic anomalies (positive, negative, and positive, respectively) above the hanging wall of the Seattle fault, Washington, USA. Analysis of these data lead to the interpretation shown in the lower map, where the sources of anomalies A, B, and C are interpreted as steeply dipping Miocene conglomerate, relatively nonmagnetic Oligocene sedimentary rocks, and Eocene volcanic rocks, respectively. Interpretation is constrained by geologic mapping, LiDAR surveys, and seismic-reflection interpretations. See Blakely et al. (2002) for details.