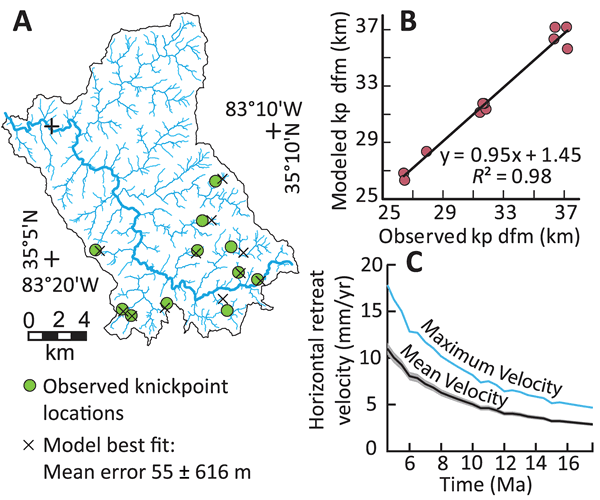
Figure 4.
Knickpoint celerity model results. Example of results from the best-fitting C and p parameters for a knickpoint travel time of 8.5 myr, which is the mean time prediction based upon the estimated basin average erosion rate from the Ahnert (1970) relationship as well as the average of the two volume-for-time estimates (see Fig. 4). (A) Observed and modeled knickpoint distribution. Mean error refers to the mean of the differences between the observed knickpoint and the modeled knickpoint distance from the mouth of the Cullasaja River. (B) Relationship between observed and modeled knickpoint (kp) positions, expressed with respect to their distance from the mouth (dfm) of the Cullasaja River. (C) Maximum and mean (gray is ±1σ error) velocity of the best fitting model result associated with each run.