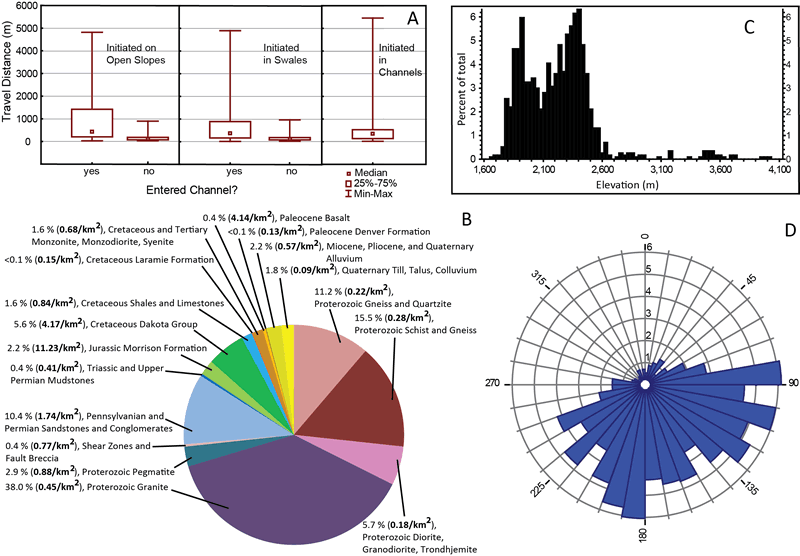
Figure 3.
Characteristics of debris flows. (A) Box and whisker plots showing travel distance data, grouped by planform morphology at headscarps, and whether or not the flows entered channels. (B) Pie chart showing distribution of headscarps by geologic unit. Percentage of total number of flows and areal concentrations (bold) are shown. Flows in Paleocene Basalt were in quarry spoil. (C) Histogram of elevations of headscarps. (D) Rose diagram showing slope aspect at headscarps. Numbers on circles are percentages of total.