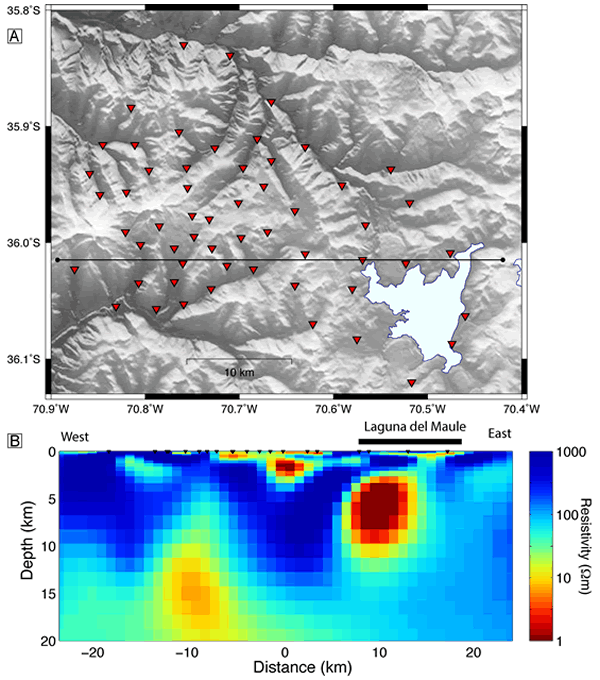
Figure 4.
(A) Locations of 56 broadband magnetotelluric (MT) stations measured during a geothermal study by Alterra Power. (B) An east-west slice of a 3-D electrical resistivity model obtained by inversion of these MT data. Location of slice shown in (A). MT data were inverted in frequency band 100–0.01 Hz and have a statistically acceptable root-mean-square fit of 1.8.