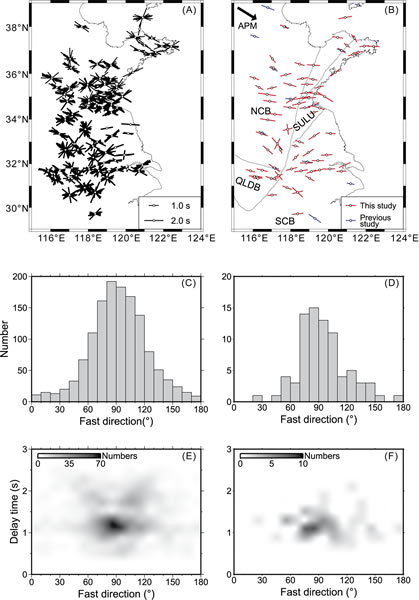
Figure 2.
(A) Individual splitting measurements plotted at each station. The orientation and length of the bars correspond to the fast direction and delay time, respectively. (B) Anisotropy map of eastern China presenting the averaged splitting measurements (red bars). Previous results are plotted in blue. APM—absolute plate motion; NCB—North China block; QLDB—Qinling-Dabie orogenic belts; SCB—South China block; SULU—Sulu orogenic belt. (C) and (D) are the histograms of the fast direction for individual and station average, respectively. (E) and (F) show the splitting parameters distribution for individual and station average, respectively.