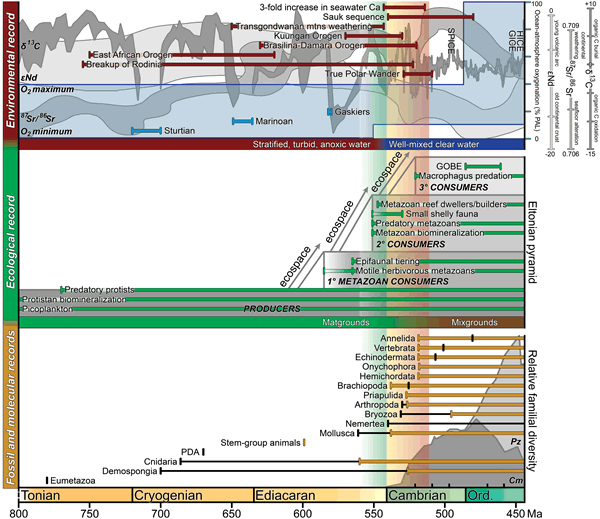
Figure 1.
Compilation of temporally associated significant events and records during the Neoproterozoic–Paleozoic transition. From bottom to top: (i) fossil (yellow bars—first appearance) and molecular (black bars—reported divergence estimates; Erwin et al., 2011) records superimposed on the Cambrian and Paleozoic faunas of Sepkoski (1981); (ii) ecological record (green bars) indicating first appearances of important behaviors/events overlain on gray rectangles comprising the Eltonian pyramid and diagrammed after megatrajectories of Knoll and Bambach (2000); and (iii) environmental record of major Earth system events (light blue bars—Snowball Earth glaciations; maroon bars—orogenies and other events), with ocean-atmosphere oxygenation data (blue-gray, Sperling et al., 2015), Nd (light gray, Keto and Jacobson, 1988) and 87Sr/86Sr estimates (mid-gray, Maloof et al., 2010), and the 13C record (dark gray, Saltzman and Thomas, 2012). The Cambrian Explosion is indicated by the yellow-orange column, and the temporal expanse of the wormworld fauna by the green column. GICE—Guttenberg Carbon Isotope Excursion; GOBE—Great Ordovician Biodiversification Event; HICE—Hirnantian Carbon Isotope Excursion; PDA—protostome-deuterostome ancestor; SPICE—Steptoean Positive Carbon Isotope Excursion.