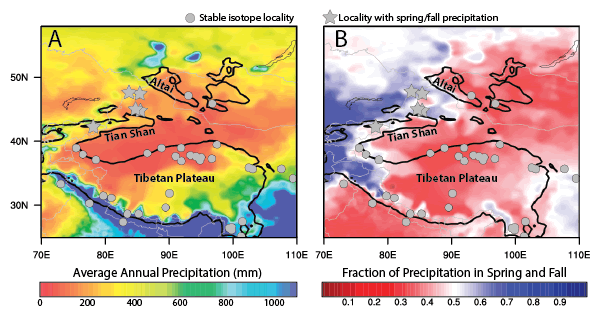
Figure 2.
(A) Average annual precipitation. (B) Fraction of precipitation that falls in spring and fall versus total spring-summer-fall precipitation. Data from the Global Precipitation Climatology Center (Meyer-Christoffer et al., 2015). Gray points—Neogene sedimentary stable isotope localities; gray stars—sites impacted by spring and fall precipitation seasonality; black line—smoothed 2000 m contour. Major ranges are labeled.