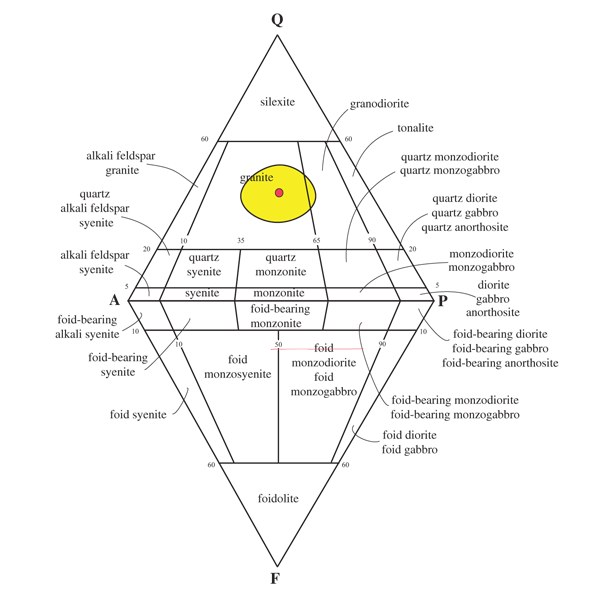
Figure 1.
IUGS classification for quartz-bearing felsic rocks comparing where a 25,25,40 granite would plot if the modal analyses were precise to less than ±1% (red dot) compared to where it would plot if the modal analysis was precise to ±10% (yellow circle).