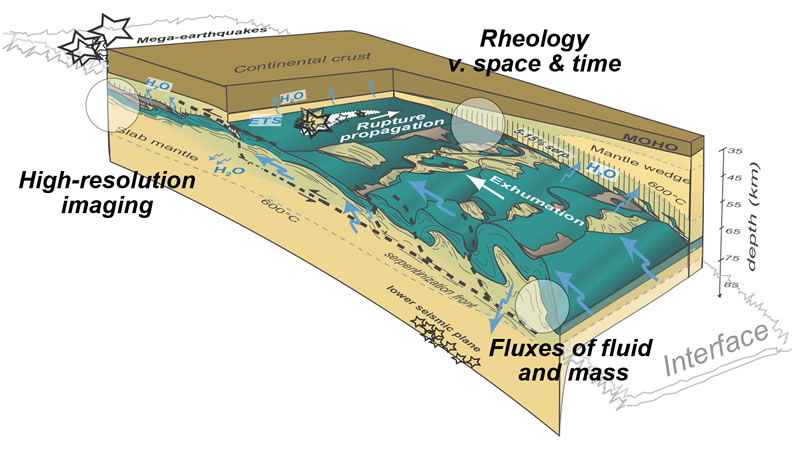
Figure 4.
Schematic view of a subduction zone between 35 and 85 km depth based on numerical model results (and on study of exhumed/exposed ophiolitic terranes) showing inferred morphologies and the detachment of large folded slices of oceanic lithosphere, accreted along the plate interface (from Angiboust et al., 2012b). This figure also illustrates the main deformation-enhanced fluid pathways (associated with deep serpentinite producing/consuming reactions), dominantly at the boundary between materials with marked rheological contrasts.