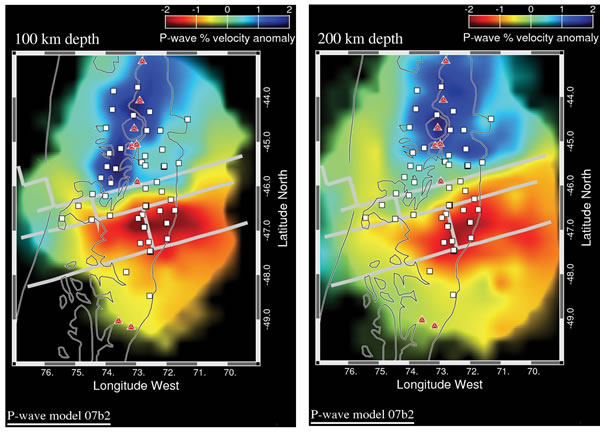
Figure 3.
Map views of P-wave velocity anomalies at 100 km (left) and 200 km (right). Velocity anomaly relative to radial Earth model IASP91 (Kennett and Engdahl, 1991) shown as a perturbation percentage; see key at upper right of each map. High velocities are blue; low velocities red; where resolution is poor, colors fade to black. The subducted Nazca lithosphere is visible as the linear NNE-trending fast anomaly, and the slow velocities of the slab window are red. Structure of the Chile Ridge projected to depth shown by heavy gray lines. Stations of the CRSP seismic network are white squares, and red triangles show locations of active arc volcanoes; note the gap in the arc in the region of the slab window. Thin white lines are Chile coastline and political border with Argentina and also mark the subduction trench westward of the coastline. At 200 km depth, note broadening and eastward shift of the high-velocity anomalies associated with the Nazca slab. Slow velocities of the slab windows also shift eastward and broaden at depth, as expected given increasing separation of the trailing edge of the Nazca slab from the leading edge of Antarctica (see Fig. 2).