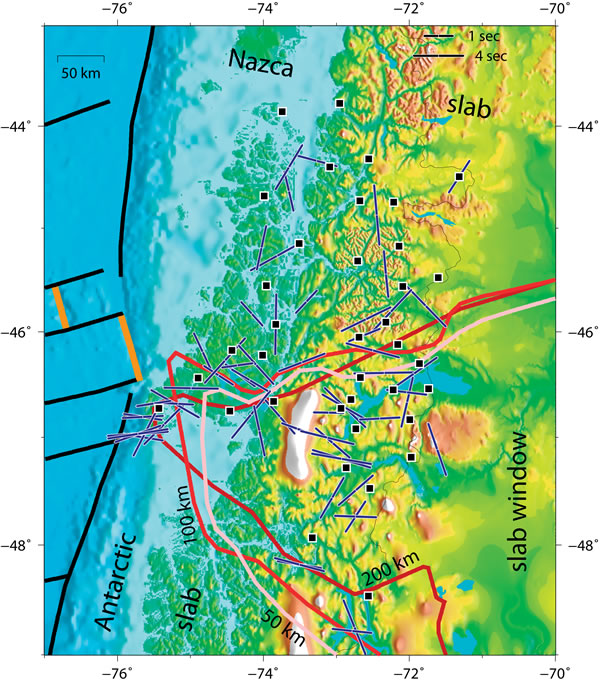
Figure 4.
Map of shear wave splitting measurements. Blue bars trend in the fast polarization direction; lengths are proportional to delay times. Fast trends are variable, but splitting delays are uniformly high (mean = 2.98 s), which is near the global maximum for teleseismic splitting. Strong, variable splitting indicates a variable upper mantle flow field beneath South America and the subducted Nazca and Antarctic slabs. Patagonian slab window boundary defined by P-wave tomography (Fig. 3), shown at three depths: heavy pink, red, and dark red lines.