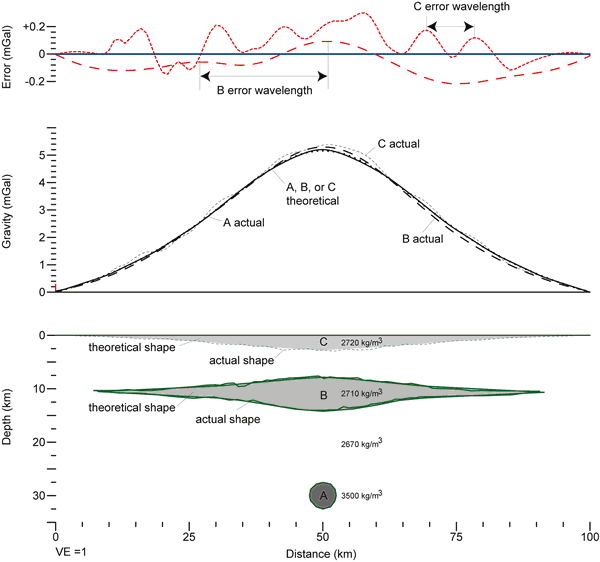
Figure 1.
Results of two-dimensional calculation of the gravity effect of the source bodies (A, B, and C) depicted in the cross section view (bottom panel). When the smooth theoretical shape of each is used, the resulting calculated anomaly is identical in all three cases, as depicted by the smooth dotted line labeled “A, B, or C theoretical.” However, when the source bodies include some irregularity in their shape, as expected in the real world, the calculated gravity anomaly will differ from the smooth theoretical result (as shown by the “B actual” and “C actual” curves). The difference between the anomalies caused by the theoretical and actual shapes is shown by the “error” curves in the top panel. These differences will depend on the depth to source bodies as illustrated by the broad wavelength for the B error curve and the narrower wavelength for the C error curve.