Figure 3.
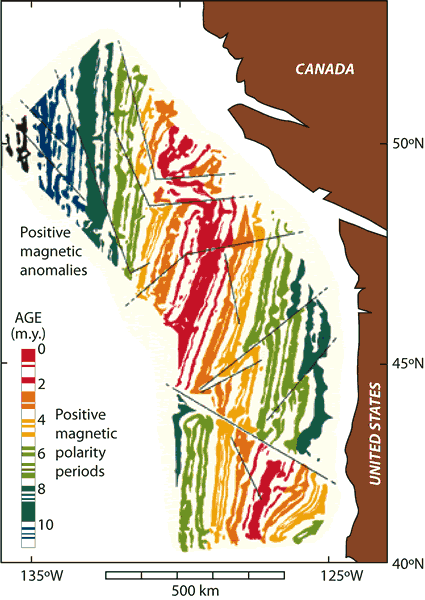
The positive magnetic anomaly stripes are colored to match their association with the geomagnetic polarity time scale (redrawn from original by Vine, 1966).

The positive magnetic anomaly stripes are colored to match their association with the geomagnetic polarity time scale (redrawn from original by Vine, 1966).