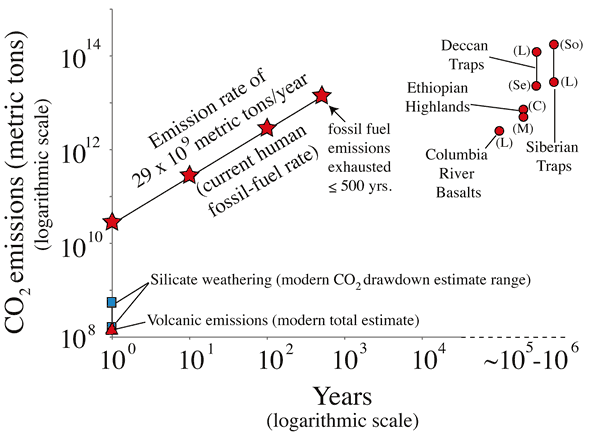
Figure 4.
Some CO2 inputs and outputs to/from Earth’s atmosphere. Extrapolated human carbon dioxide emission rates (red stars) (www.eia.gov; U.S. Energy Information Administration, 2010) as compared to selected LIP emission estimates over an assumed duration of 105 yr. LIP CO2 rates were calculated from LIP volume estimates multiplied by 14 × 106 metric tons of CO2 emitted for each cubic kilometer of basalt (Self et al., 2006). Sources of volume estimates are labeled as follows: L—Large Igneous Province Commission website (www.largeigneousprovinces.org); C—Courtillot et al. (1999); M—Mohr (1983); Se—Self et al. (2006); So—Sobolev et al. (2011). This calculation does not consider amplification by contact metamorphism or clathrate release. Rates of silicate weathering drawdown (blue squares) are from Hilley and Porder (2008). Average annual volcanic emissions (red triangle) are from Williams et al. (1992). Values from Gaillardet and Galy (2008) for silicate weathering drawdown (5.1 × 10⁸ metric tons of CO2/yr) and volcanic plus metamorphic release (3.0 × 10⁸ metric tons of CO2/yr) are consistent with values shown in this diagram.