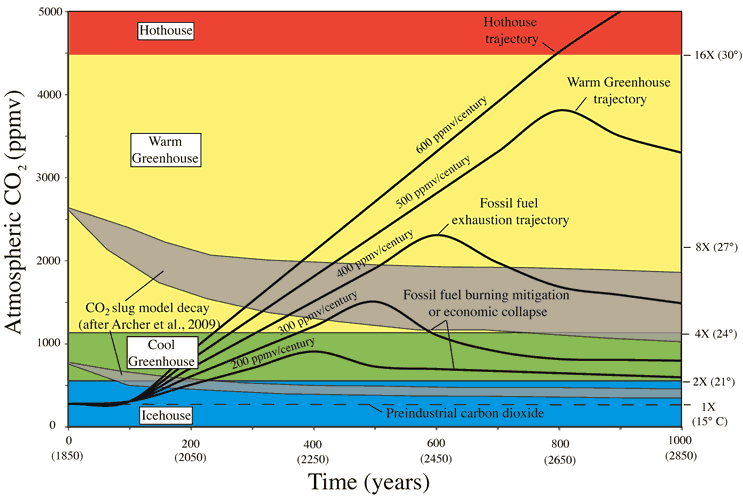
Figure 5.
Projected examples of a range of future carbon dioxide emission scenarios plotted against the backdrop of climate state thresholds taken from Figure 3. The carbon dioxide trajectory curves begin with an assumed rate increasing CO2 by 200 ppmv/century (our modern rate of 2 ppm/yr). The other curves show the hypothetical effect of increasing that rate by increments of 100 ppmv/century when plotted against the icehouse, greenhouse, hothouse thresholds developed herein. We assume various reasons for initiation of curve declines (e.g., human intervention, economic collapse, exhaustion of fossil fuels). Atmospheric declines in CO2 with time approximate model results of Archer et al. (2009) that show increasing residence time of CO2 as the size an instantaneous slug (injection) increases. The starting point for the Archer et al. (2009) CO2 injections is arbitrarily placed at 1850 so as to distinguish those slugs from the slower rates of human injection shown by the trajectory curves. We follow the suggestion of Park and Royer (2011) that temperature sensitivity to CO2 doublings is more substantial in icehouses (6–8 °C) than in warmer climate states (3–4 °C). We adopt the low end of both sensitivity ranges in this figure.