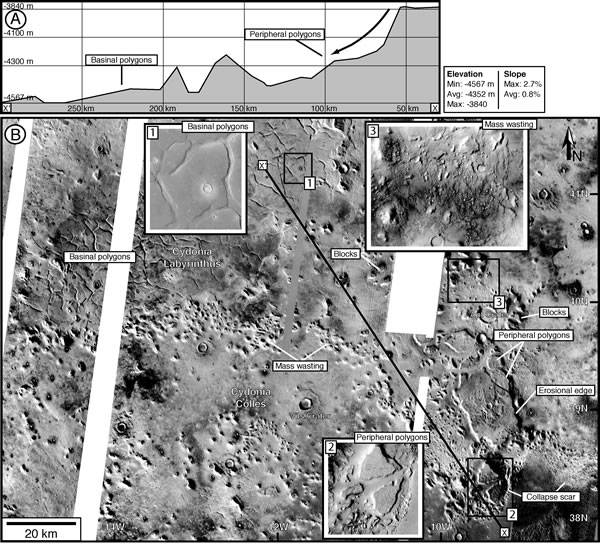
Figure 1.
(A) Profile using THEMIS and MOLA imagery showing topographic differences between areas of large-scale Martian peripheral and basinal polygons in Acidalia Planitia. This profile was used to calculate maximum (2.7%) and average (0.8%) slope values. (B) Map showing basinal and peripheral polygons in Acidalia Planitia.