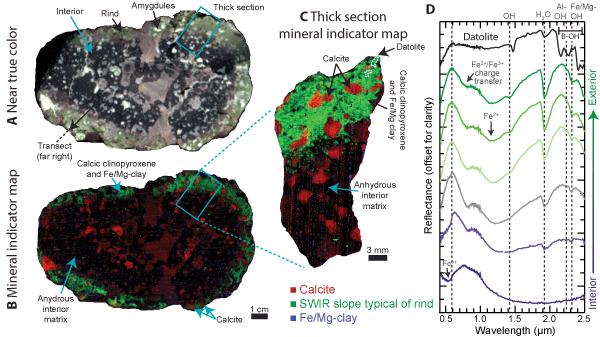
Figure 3.
(A) Color composite image from a hyperspectral image acquired with the same imaging system used in Figure 2, approximating the true color of a pillow lava cross section. (B) Mineral indicator map showing calcite in red, a spectral slope indicative of the rind in green, and Fe/Mg-clay in blue. The cyan box shows the approximate location of the material on the adjacent cut face from which a thick section was prepared and imaged. (C) Mineral indicator and spectral parameter image of the thick section using the same parameters as (B). The dashed white outline shows the location of identified datolite. (D) Plot with spectral transect from the interior through the alteration rind (purple to green; location of transect shown in A). The spectrum of the innermost point (purple) reflects the oxidized, anhydrous nature of the interior matrix. Spectra of the rind (green) are consistent with an Fe/Mg-clay (chlorite and/or nontronite) and calcic clinopyroxenes. Guidelines show absorption features due to various molecular vibrations or other key spectral characteristics. A scaled, three-point moving average spectrum of datolite (black) acquired within the thick section is also shown. This figure is modified from data presented in Greenberger et al. (2015a).