
Page 7 - i1052-5173-28-6
P. 7
runs of apparent linearity (e.g., Fig. 2). Are Randomly-distributed
the several subpopulations of plate areas
suggested by Bird (2003), Morra et al. Plate Centers
(2013), Harrison (2016), and Mallard et al. 95%
(2016) statistically distinct from apparently Number12
linear runs manifest in the sparse sampling
of a broken sheet? African 50%
Antarctic, North American
In order to address that question, we
consider the tabulation of 20 plate areas Eurasian
from Gurnis et al. (2012) used by Morra et South American
al. (2013) to define two subpopulations of
plate sizes (Figs. 1B and 2A). As noted, Pacific
these plate sizes are closely approximated Australian
by areas in which diameters are exponen- North Bismarck
tially distributed—the broken sheet func- 10 5%
tion (Fig. 1B). If we randomly draw a sam-
ple of 20 areas from such a theoretical Average = 8 ± 2.5
population, by chance the resultant array 8 n = 52
will exhibit some number of apparent lin-
ear runs in log plate area versus log 6
exceedance space (Fig. 2B). In order to
quantify the degree of spurious linearity 4
apparent in such randomly sampled popu-
lations, we repeatedly calculate the slopes 2
and correlation coefficients for the two
linear trends that most closely match the 0 2 4 6 8 10 12 14 16 18 20 22 24
sample areas in such a model array, deter-
mine the sample (plate) number and area Neighbor Centroids Within 5,000 km
where the intersection between these two
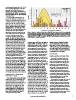
linears occurs, and calculate the differ- Figure 3. Number of neighbor plate centers within 5,000 km of plate centroids (bars) and Monte
ences in their slopes. Based on this exer- Carlo simulation of numbers of neighbors apparent among 500 model sets of randomly distributed
cise, it becomes apparent that the R2 values plate centers (yellow envelope). Names of several larger plates and those with fewest (African) and
of all spurious linear arrays (Fig. 2C), as most (north Bismarck) neighbors are above appropriate bars. Note that 16 plates have 17 or more
well as the differences between their neighbors (darker red bars), a density that reflects a spatial association of smaller plates; all of
slopes (Fig. 2D), comprise populations that these occur in the southwestern Pacific.
completely overlap similar parameters
derived from the Gurnis et al. (2012) data. homogeneous as well; that is, the numbers hypothesis that the distribution of plate
Because we cannot reject the null hypoth- of plates within some distance of the cen- sizes is truly random. Those observed
esis that all of these areas were drawn from troid of any other plate might exhibit a uni- plates with 17 or more neighbors within
the same size-frequency distribution, any modal distribution. Conversely, if plates 5,000 km (Fig. 3) are located exclusively in
proposition that they somehow exemplify were geographically associated by size, the southwestern Pacific; no other part of
several distinct subpopulations of plate then numbers of neighbors within some the Earth exhibits a statistically significant
areas becomes untenable. Proposed linear distance of any plate center might exhibit concentration of tectonic plates.
runs of plate areas are entirely consistent some sort of multimodal frequency distri-
with the sparse sampling of a broken sheet. bution, with smaller distances separating DISCUSSION
smaller plate centroids, and larger dis-
GEOGRAPHIC CLUMPING OF tances separating larger. Among the Bird Numbers and Sizes of Tectonic Plates
TECTONIC PLATES (2003) data, the closest pair of centroids is
that of the North Bismarck and Manus In general, the numbers and areas of
Given that a broken sheet model of plate plates off Papua New Guinea (235 km); no modern tectonic plates are closely repli-
fragmentation, wherein geographic loca- plates have any neighbors within a smaller cated by the distributions expected when
tions of plate boundaries are randomly distance. Conversely, the most widely sep- locations of boundaries are largely inde-
distributed across the Earth’s surface, is in arated centers are those of the South pendent; to a first approximation, the
good agreement with observed areas of American and Philippine Sea plates Earth’s lithospheric surface is randomly
plates (Fig. 1), we might then ask if the (19,412 km); at that (or any greater) dis- subdivided. That several smaller plates
Earth’s plates also exhibit random geo- tance, all centroids have 51 neighbors. exhibit geographic association also sug-
graphic dispersal. If the distribution of Taking 5,000 km as a working distance, gests that actual fragmentation is more
plate boundaries was laterally homoge- the frequency of so-defined neighbors for accurately characterized as a spatially het-
neous, then it follows that the areas of any one of the Bird (2003) plates ranges erogeneous Poisson process; the probabil-
those plates should be spatially from 1 to 23 (Fig. 3). Moreover, Monte ity of crossing some plate boundary varies
Carlo simulations show that the number of with geographic position, being higher
neighbors within 5,000 km of randomly across the southwestern Pacific.
distributed centroids in fact does comprise
a Gaussian distribution with a mode of ~8 Understanding the reasons for differing
neighbors, the modal number expected for numbers and sizes of tectonic plates is
the centroids of 52 plates haphazardly dis- important from a number of perspectives.
persed across ~510 × 106 km2 of the Earth’s As noted, difference in plate areas might
surface (Fig. 3). Because several plates implicate different processes in their evo-
exhibit numbers of neighbors that fall well lution, with larger plates being carried and
above 95% confidence limits for randomly transported by mantle convection and
placed centroids, we can reject the null smaller ones undergoing greater amounts
of brittle deformation along regions of con-
vective convergence. The greatest
www.geosociety.org/gsatoday 7