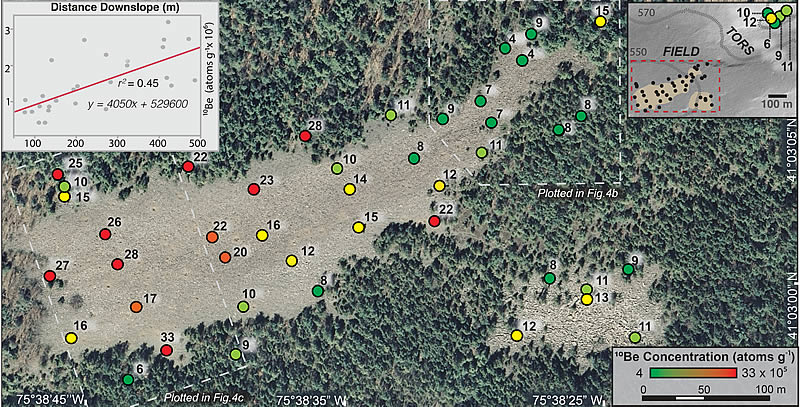
Figure 3.
10Be concentration (105 atoms g−1) of Hickory Run boulders and tors; red dots indicate higher 10Be concentration; green dots indicate lower. Insets show location of tors (Fig. 1C) relative to the main boulder field and positive correlation between 10Be concentration and downslope distance.