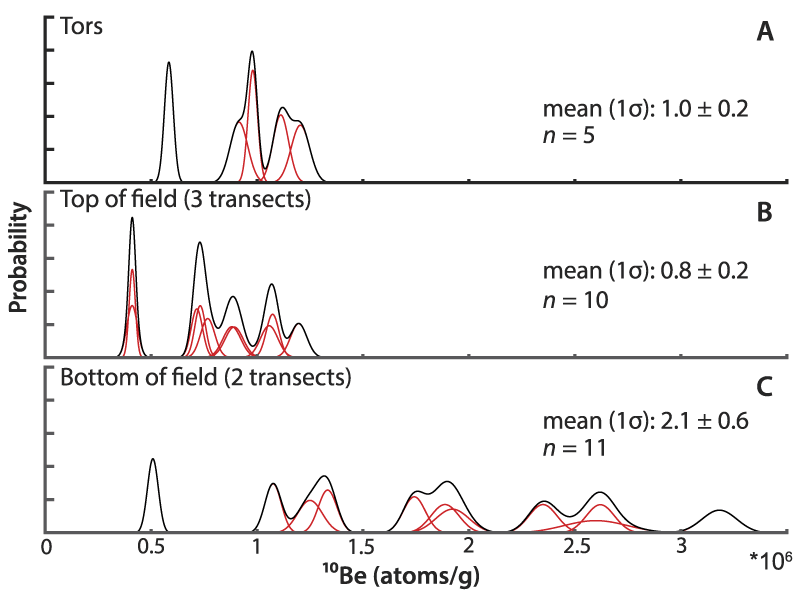
Figure 4.
Summed probability plot of 10Be concentrations (A) in tors, (B) of the three furthest upslope boulder transects, and (C) of the two furthest downslope. Red curves represent single 10Be measurements with 2σ internal error; the black line represents the sum of all samples.