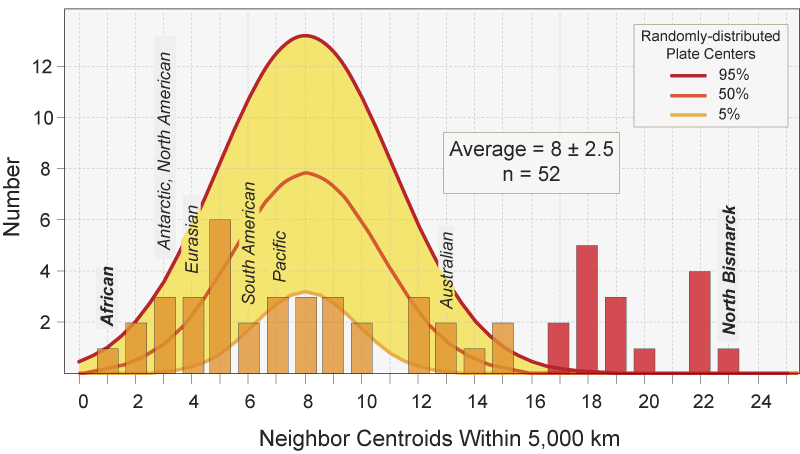
Figure 3.
Number of neighbor plate centers within 5,000 km of plate centroids (bars) and Monte Carlo simulation of numbers of neighbors apparent among 500 model sets of randomly distributed plate centers (yellow envelope). Names of several larger plates and those with fewest (African) and most (north Bismarck) neighbors are above appropriate bars. Note that 16 plates have 17 or more neighbors (darker red bars), a density that reflects a spatial association of smaller plates; all of these occur in the southwestern Pacific.