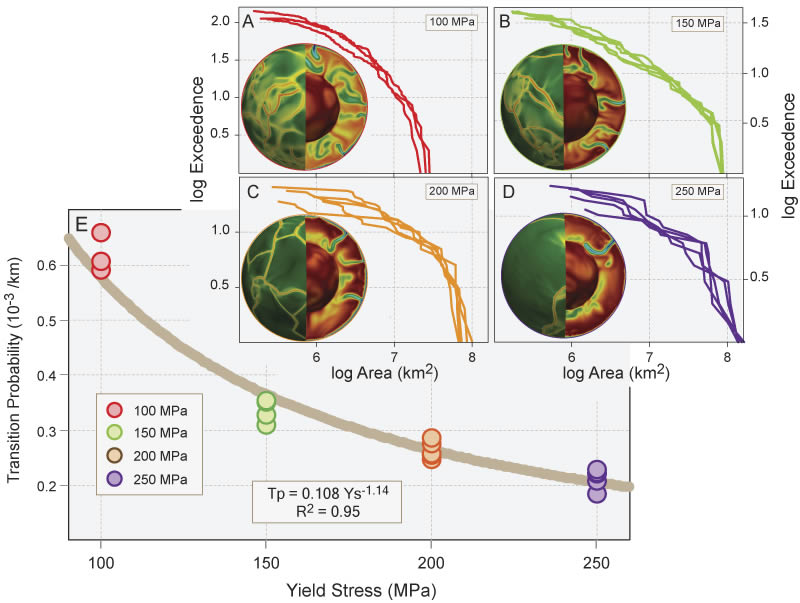
Figure 4.
(A–D) Convection in 3D spherical models of mantle convection (inset Earth models) and the logarithm of plate size versus log exceedance (cumulative count) (colored lines) for yield stresses of 100, 150, 200, and 250 MPa from Mallard et al. (2016). (E) Transition probabilities for broken sheets calculated for the 18 arrays of plate area and number (colored lines in [A–D]). Relations between model yield stresses and transitions probabilities defined an approximate power law relation between stress at model plate boundaries and degree of plate fragmentation.