
Page 6 - i1052-5173-32-7
P. 6
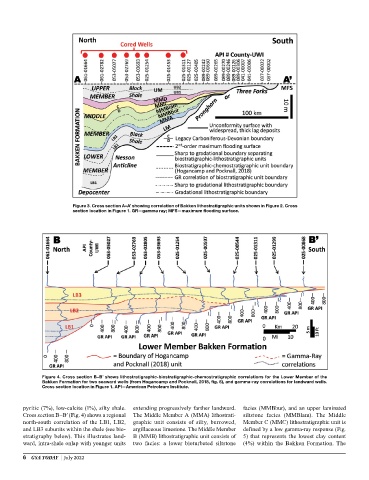
Figure 3. Cross section A–A′ showing correlation of Bakken lithostratigraphic units shown in Figure 2. Cross
                         section location in Figure 1. GR—gamma ray; MFS—maximum flooding surface.


               Figure 4. Cross section B–B′ shows lithostratigraphic-biostratigraphic-chemostratigraphic correlations for the Lower Member of the
               Bakken Formation for two seaward wells (from Hogancamp and Pocknall, 2018, fig. 5), and gamma-ray correlations for landward wells.
               Cross section location in Figure 1. API—American Petroleum Institute.


         pyritic (7%), low-calcite (1%), silty shale.   extending progressively farther landward.   facies (MMBbur), and an upper laminated
         Cross section B–B′ (Fig. 4) shows a regional   The Middle Member A (MMA) lithostrati-  siltstone facies (MMBlam). The Middle
         north-south correlation of the LB1, LB2,   graphic unit consists of silty, burrowed,   Member C (MMC) lithostratigraphic unit is
         and LB3 subunits within the shale (see bio-  argillaceous limestone. The Middle Member   defined by a low gamma-ray response (Fig.
         stratigraphy below). This illustrates land-  B (MMB) lithostratigraphic unit consists of   5) that represents the lowest clay content
         ward, intra-shale onlap with younger units   two facies: a lower bioturbated siltstone   (4%) within the Bakken Formation. The

         6  GSA TODAY  |  July 2022