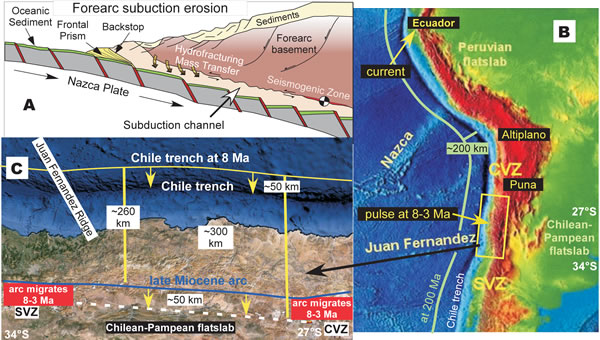
Figure 2.
Images for forearc subduction erosion. (A) Figure adapted from von Huene et al. (2004) and Goss and Kay (2006) showing the general model for forearc subduction–eroded material transported in the subduction channel between the upper and lower plate. (B) Relief map of the Andes showing the Chile trench, the subducting Nazca and Juan Fernandez aseismic ridges on the Pacific plate, and the high central Andean Puna–Altiplano plateau and surrounding flat-slab regions. The green line shows the approximate position of the Chile trench at ca. 200 Ma given that the trench has migrated eastward in response to forearc subduction erosion as tracked by the eastward displacement of the magmatic arc (e.g., Scholl and von Huene, 2007). The yellow arrows point to regions of forearc subduction erosion pulses at 8–3 Ma on the Chilean margin and today on the Ecuadorian margin. (C) Google Earth image illustrating the proposed ~40–50 km displacement of the Chilean trench between 27°S and 34°S to compensate for the eastward displacement of the magmatic arc (Kay et al., 2005; Goss et al. 2013; see text).