
Full Text View
Volume 26 Issue 2 (February 2016)
GSA Today
![]()
Article, pp. 4-10 | Abstract | PDF (2.1MB)
The 2014–2015 Pāhoa lava flow crisis at Kīlauea Volcano, Hawai‘i: Disaster avoided and lessons learned
| Table of Contents |
|---|
Search GoogleScholar for
Search GSA Today |
Abstract
Lava flow crises are nothing new on the Island of Hawai‘i, where their destructive force has been demonstrated repeatedly over the past several hundred years. The 2014–2015 Pāhoa lava flow crisis, however, was unique in terms of its societal impact and volcanological characteristics. Despite low effusion rates, a long-lived lava flow whose extent reached 20 km (the longest at Kīlauea Volcano in the past several hundred years) was poised for months to impact thousands of people, although direct impacts were ultimately minor (thus far). Careful observation of the flow reaffirmed and expanded knowledge of the processes associated with pāhoehoe emplacement, including the direct correlation between summit pressurization and flow advance, the influence of existing geologic structures on flow pathways, and the possible relationship between effusion rate and flow length. Communicating uncertainty associated with lava flow hazards was a challenge throughout the crisis, but online distribution of information and direct contact with residents proved to be effective strategies for keeping the public informed and educated about flow progress and how lava flows work (including forecasting limitations). Volcanological and sociological lessons will be important for inevitable future lava flow crises in Hawai‘i and, potentially, elsewhere in the world.
* Now at U.S. Geological Survey California Volcano Observatory, Menlo Park, California 94025, USA.
** Now at U.S. Geological Survey Cascades Volcano Observatory, Vancouver, Washington 98683, USA.
Manuscript received 3 Sept. 2015; accepted 30 Oct. 2015
doi: 10.1130/GSATG262A.1
INTRODUCTION
Basaltic lava flows were very much in the news in 2014. In August of that year, Bárðarbunga erupted in Iceland, eventually extruding more than a cubic kilometer during six months of activity (Gíslason et al., 2015). Pico do Fogo in the Cape Verde islands began erupting in November, sending out lava flows that overran two villages and displaced ~1,000 people (González et al., 2015). And in June 2014, an outbreak of lava at Kīlauea Volcano sent flows toward communities in the Puna District on the east side of the Island of Hawai‘i (Fig. 1).
Kīlauea’s outbreak was noteworthy for its potential (and uncertain) impact and long months of anticipation by communities at risk. Had the flow extended far enough along the path it was following, it would have crossed a highway used by thousands of vehicles each day; isolated a portion of the island that is home to nearly 10,000 residents (Callis, 2014); cut power, water, and other infrastructure on which those residents depend; and overrun homes in multiple communities. The flow stalled repeatedly within several hundred meters of the highway, destroying only one house before breakouts ~15 km upslope in March 2015 diverted lava away from the front. The activity provided new information about the behavior of pāhoehoe lava flows, as well as lessons about communicating information to the public during a prolonged crisis. Although the 2014–2015 crisis has passed, the lava flow remains active and could threaten communities in the future.
|
Map of the eastern portion of Kīlauea Volcano, which comprises the Puna District of the Island of Hawai‘i. Red dot in caldera gives location of 2008–present eruptive vent. GPS stations indicated by white circles and tiltmeter by white triangle. East Rift Zone noted by white dashed line, with Pu‘u ‘Ō‘ō eruptive vent labeled and lava flows from 1983 to 2015 colored as gray—1983–2013; pink—2013–2014 Kahauale‘a lava flows; red—2014–2015 June 27th lava flow (as of 5 Aug. 2015). Pāhoa and Kaohe Homesteads (“KH”) are labeled, as is Highway 130 connecting Pāhoa and nearby communities to the rest of the island. Black lines are roads, with thicker lines indicating more heavily used roads. Denser groupings of roads occur in subdivisions. Blue lines are paths of steepest descent based on analysis of topography. Area of heavily cracked ground occurs between labeled arrows. Lower right gives zoom of the June 27th flow, with colors indicating flow extent over time. |
 Figure 1
Setting the Stage
Kīlauea, one of the most active volcanoes in the world, has erupted almost continuously from East Rift Zone (ERZ) vents since 1983 and from a vent at the summit (which hosts an active lava lake) since 2008 (Orr et al., 2015a; Patrick et al., 2015a) (Fig. 1). The current ERZ eruption has extruded more than 4 km3 of lava, covering more than 142 km2 of land (updated from Orr et al., 2015a). Such a large amount of lava has had a significant impact on island residents, destroying 215 primary structures as of 2015, including nearly all of the village of Kalapana in 1990. Roads and other infrastructure have also been covered, and vog (volcanic smog) has impacted the health of people, animals, and agricultural products across the island.
Pu‘u ‘Ō‘ō, a cinder cone and lava shield, is the dominant vent for the ongoing ERZ eruption, although other vents within a few kilometers uprift and downrift have also been active. Following an uprift fissure eruption in March 2011, lava slowly filled the crater of Pu‘u ‘Ō‘ō until September 2011, when a small fissure eruption on the east flank of the cone fed the informally named Peace Day lava flow. A lava tube system developed, and within weeks, lava flowed southeast from the vent more than 10 km to the Pacific Ocean (Orr et al., 2015a). While this behavior is common for the current ERZ eruption, the lava discharge rate for the Peace Day flow was low (1–2 m3/s), which is about half the average rate measured since 1983 (Poland, 2014).
The eruption remained relatively stable until January 2013, when lava overtopped the crater of Pu‘u ‘Ō‘ō and spread to the northeast. The new flows, informally named the Kahauale‘a flows (Patrick et al., 2015b), gradually became dominant, and the Peace Day flow ceased activity by November 2013. The northeast trajectory of the Kahauale‘a flows was significant because of the population downslope in the island’s lower Puna District (Fig. 1). Pu‘u ‘Ō‘ō lies at the topographic crest of the ERZ, so the direction that lava travels is dependent on the location from which lava is extruded. Lava that erupts from the south side of Pu‘u ‘Ō‘ō flows south toward the ocean, whereas lava that erupts from the north side flows northeast toward residential and commercial areas (Patrick et al., 2015b) (Fig. 1).
Puna is a zone of high lava flow hazard due to frequent inundation during the past several hundred years (Kauahikaua and Tilling, 2014). In 2007, a northeast-directed flow caused concern because, had it followed the most likely path of steepest descent, it would eventually have imperiled downslope communities (Kauahikaua, 2007); however, after a few months, a breakout at the vent directed lava to the south and stopped the northeast advance. Although no such change in direction occurred in 2013, the low–effusion-rate conditions that characterized the Peace Day flow persisted, and lava never advanced more than 9 km from Pu‘u ‘Ō‘ō through mid-2014 (Patrick et al., 2015b).
The June 27th Lava Flow
The first indication of an impending change in activity at Kīlauea was the onset of sustained inflation at the volcano’s summit and at Pu‘u ‘Ō‘ō in late May 2014 (Fig. 2). Inflation indicates increasing pressure within the volcano’s magmatic system and often precedes intrusions and the formation of new eruptive vents (e.g., Orr et al., 2015a). The pressurization culminated on 27 June 2014, when new fractures opened on the northeast flank of Pu‘u ‘Ō‘ō (Fig. 3A). This new vent system diverted lava from the Kahauale‘a flows, which ceased all activity soon after (Patrick et al., 2015b). The initial pulse of the “June 27th lava flow,” as it was informally called, advanced quickly along a narrow front to the east-northeast (Fig. 1). The flow emerged from near the base of Pu‘u ‘Ō‘ō, ~50 m lower than the source of the Kahauale‘a flows, and drainage of magma contributed to early high effusion rates and rapid flow-front advance.
|
Distance change between continuous GPS stations spanning Kīlauea’s summit (black) and Pu‘u ‘Ō‘ō (blue) during 2014. Positive change is generally indicative of inflation and negative, deflation. Red line marks 27 June 2014. Station locations are given in Figure 1. |
 Figure 2
|
(A) New vents formed on the NE flank of Pu‘u ‘Ō‘ō cone on 27 June 2014, ~50 m below the elevation of the previously active vent for the Kahauale‘a flows. Aerial view looking WSW. (B) Lava flowed within ground cracks in Aug.–Sept. 2014, with small plumes of condensed steam marking the extent of activity. Aerial view looking ENE along East Rift Zone. (C) Asphalt burns as lava crosses a road on the outskirts of Pāhoa on 25 Oct. 2014. The utility pole at right, surrounded by lava, has been wrapped in insulation and its base covered by cinder. These measures prevented the pole from burning for a time, but after several days, the pole collapsed. (D) Lava crosses through a fence on private land in Pāhoa on 28 Oct. 2014. (E) Several lobes of the lava flow threatened the town of Pāhoa and its highway during late 2014 and early 2015. Aerial view looking south. Damaged transfer station is labeled, and location of house destroyed by lava is noted by red circle. (F) Community meetings in Pāhoa were an effective means of sharing the latest hazards information with the public. During Sept.–Oct. 2014, some individual meetings were attended by more 600 people. Photo locations are indicated by place names and feature labels in Figure 1. All photos by U.S. Geological Survey. |
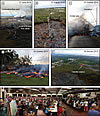 Figure 3
Lava reached ~4.5 km from the vent over the ensuing month, developing a lava tube system to feed the distal part of the flow. The floor of Pu‘u ‘Ō‘ō subsided throughout this period as magma continued to drain from the edifice; deflation did not cease until the end of July (Fig. 2). On 21 August, the June 27th flow was 9.4 km downslope from Pu‘u ‘Ō‘ō in a densely forested area, where it encountered a series of large ground cracks parallel to the rift zone. Lava flowed into the crack system and advanced within it for 1.3 km, with the inferred location of the flow front indicated by the downrift extent of small plumes of condensed steam in the forest (Fig. 3B). The flow emerged from the crack system 11.4 km downslope from Pu‘u ‘Ō‘ō on 24 August but repeated its disappearing act—entering a crack and then emerging downslope days later—three more times. Lava cleared the region of heavily cracked ground on 6 September at a point 13.3 km from Pu‘u ‘Ō‘ō, within a few kilometers of the rural Kaohe Homesteads subdivision above the town of Pāhoa (Fig. 1).
Over the succeeding weeks, the flow skirted the northwest margin of Kaohe Homesteads, stalled in late September, resumed its advance at the end of September, and, in mid-October, stalled again ~1 km from the uppermost road of Pāhoa (Fig. 1). The flow began advancing again on 22 October and crossed the road on 25 October (Fig. 3C) before passing through a cemetery and across private land (Fig. 3D), winding its way between several residences that homeowners protected with hastily constructed berms of soil and cinder. By 30 October, the flow was within ~150 m of Pāhoa’s main street (Figs. 1 and 3E), where it stalled, widening slightly without advancing over the ensuing days. This widening damaged the Pāhoa solid waste transfer station and, on 10 November, claimed a residence upslope of the flow front—the only dwelling to be destroyed during the 2014–2015 Pāhoa lava flow crisis.
The events of late September to early November established a pattern that was to recur several times during the months that followed: the lava flow front advanced, stalled, and widened, and then became inactive due to fluctuating supply of lava from the source vent and breakdowns in the lava tube. Upslope breakouts then formed a new lobe that advanced alongside the previous one (Fig. 1). In late January 2015, one of these lobes was within ~500 m of Highway 130, which links Pāhoa and nearby communities to the rest of the island (Fig. 3E), but this lobe also stalled and widened. New breakouts near Pu‘u ‘Ō‘ō in mid-March robbed the downslope flow field of its supply of lava, and flows near Pāhoa became inactive, thus ending the crisis. Since then, lava has not advanced beyond ~9 km from Pu‘u ‘Ō‘ō.
June 27th Lava Flow Hazards Assessment, Mitigation, and Impact
The response to the 2014–2015 Pāhoa lava flow crisis by the public, businesses, and federal, state, and county agencies was as complex as the June 27th flow itself. The Hawaiian Volcano Observatory (HVO) tracked the lava flow by helicopter overflights, ground-based mapping, and satellite imagery, working closely with Hawai‘i County Civil Defense (HCCD) to map flow progress. Observations were more frequent as the flow neared homes, involving a continuous presence on the ground during the height of the crisis. HVO and HCCD shared data on flow activity and issued frequent updates, maps, and imagery via the Internet and media outlets. HCCD updates played on the radio, and an information and command center was opened in Pāhoa while active lava was near the town.
At the direction of the mayor, the County of Hawai‘i organized a community meeting in Pāhoa on 27 August 2014—two days after HVO’s first press release and 10 days before the mayor would issue an emergency declaration. For the next several months, these community meetings were at least a weekly occurrence, with attendance at some meetings exceeding 600 people (Fig. 3F). Overview presentations by HVO, the mayor, HCCD, and, occasionally, local and national elected representatives were followed by individual interactions among members of the public, HVO staff, state and county agencies, and many other groups (the Red Cross, the Federal Emergency Management Agency [FEMA], Hawai‘i Volcanoes National Park, etc.).
The meetings built trust among scientists, managers, and the community and helped residents and businesses understand the products used to show the flow location and likely pathways. Equally important, the meetings gave residents a perspective on the nature of pāhoehoe flows and limitations in forecasting flow activity. The most important products were current lava flow maps that included potential flow paths (Fig. 4) based on topographic steepest-descent calculations (Kauahikaua et al., 2003; Kauahikaua, 2007). Online release of the maps was eagerly anticipated by the community, and HVO and HCCD devoted significant resources to collecting lava flow data, developing products for rapid public release, and updating the products in response to user feedback.
|
Map distributed to the public on 1 Dec. 2014, showing June 27th lava flow on 24 Nov. 2014 (pink), and expansion as of 1 Dec. 2014 (red). Blue lines are calculated paths of steepest descent. Black lines are roads. |
 Figure 4
Estimation of the lava’s likely time of arrival at a given area was the most unreliable forecasting parameter because the advance rate varied rapidly between 0 and 500 m/day (Fig. 5). The measured advance rates, however, provided a range of potential arrival times that were used to develop contingency plans. For example, the county expended significant effort to ensure that alternate routes were operational in advance of the potential inundation of Highway 130, which would have cut off several thousand residents from the rest of the island. This effort cost about US$15 million, but will mostly be reimbursed by FEMA (Nakaso, 2015a) thanks to a Disaster Declaration signed by President Obama on 3 November 2014 (Moseley, 2014). Attempts were also made to time the deployment of National Guard units and other public safety personnel and to harden power (Fig. 3C) and water supply systems. Infrastructure protection before the arrival of the lava flow involved consultations by utility companies with HVO and University of Hawai‘i at Hilo researchers and is an example of collaborations that formed during the crisis.
|
Advance rate of June 27th lava flow (blue) versus tilt at Kīlauea’s summit measured radial to the caldera (azimuth 327°; red). Positive tilt indi-cates inflation and negative, deflation. Tiltmeter location given in Figure 1. |
 Figure 5
Thus far, direct impacts from the June 27th lava flow have been minimal, considering the potential destruction. Only one house was lost, one utility pole destroyed (power was never interrupted), and the Pāhoa solid waste transfer station sustained only minor damage and returned to service in March 2015. Indirect impacts, however, were substantial. Real estate values plummeted as the flow advanced toward Pāhoa, and many residents—perhaps 10%–15% of the area’s population—moved away from the region (Nakaso, 2015b). Since flow activity near Pāhoa ceased in March 2015, however, the housing market has rebounded (Stewart, 2015).
As soon as the June 27th lava flow threat was realized, public debate began regarding lava flow diversion. Some residents supported intervention to protect homes and businesses, while others strongly opposed any interference, due to the long-term cost of diversion efforts once started, potential for litigation, cultural sensitivities, and the low probability of long-term success. Ultimately, diversion was not attempted in any official capacity.
New Insights Into Lava Flow Emplacement
The June 27th flow is significant for not only the havoc it has caused, but also its globally unprecedented style. The overall low effusion rate (1–2 m3/s), lack of limits on its extent (by the ocean, for example), interaction with existing ground cracks, and 20 km length (longest at Kīlauea in at least the past 500 years; Clague et al., 1999) combine to make the June 27th flow the longest-lived low-effusion-rate pāhoehoe flow known on Earth. Data collected throughout its evolution has helped to elucidate lava flow processes, which may aid in future crises in Hawai‘i and elsewhere.
Pressure fluctuations in the summit magma reservoir had a significant impact on the behavior of flows that were ~40 km downrift. Stalling of the flow front was generally preceded by summit deflation, while rapid flow advance at the stalled front or of upslope breakouts often followed summit inflation (Fig. 5). Cyclic deflation-inflation (DI) events at the summit are a common occurrence at Kīlauea (Anderson et al., 2015) and clearly impact eruptive vigor from Pu‘u ‘Ō‘ō, where the slightly attenuated tilt cycles are also recorded (Orr et al., 2015b). The June 27th flow further demonstrated the importance of these relatively minor pressure fluctuations within the summit magma reservoir on distal lava flow activity. Summit deformation may, in fact, provide a means of forecasting effusion rates (Patrick et al., 2015a). Decreases in flow-front vigor were also impacted by upslope leaks along the length of the lava tube system, highlighting another control on flow advance.
The data that connect summit deformation to flow advance may be useful for improving models of pāhoehoe flow hazards by providing a means of anticipating changes in effusion and advance rates. Lava-emplacement models, coupled with high-resolution topography, do a good job of approximating flow pathways (e.g., Favalli et al., 2005; Harris and Rowland, 2015), but forecasting advance rate remains problematic, especially for pāhoehoe flows. No forecasts of the June 27th flow advance rate proved accurate, although they were still useful to emergency managers for understanding the time frames of potential impacts. Research into the physics of pāhoehoe flows—particularly the interaction among topography, effusion rate, lava tube formation and collapse, and flow characteristics (e.g., crystallinity, volatiles, temperature, and composition)—is needed to address this limitation in current models.
One of the most obvious questions regarding the June 27th flow is why it traveled no farther than 20 km from its source. For ‘a‘ā lava flows, a well-established relationship, governed by flow cooling, exists between maximum flow length and effusion rate (Walker, 1973). No such relation is known for pāhoehoe flows, however, because they frequently form insulating tubes, enabling them to travel much farther than would otherwise be possible (Keszthelyi, 1995; Kauahikaua et al., 1998, 2003). Long-lived pāhoehoe flows with 1–2 m3/s discharge rates, however, represent a largely unknown low-effusion-rate end member for that lava flow style. The June 27th flow’s low effusion rate, coupled with cooling, crystal growth, loss of volatiles, lava tube breakdown, and other factors, might indicate that—at 20 km from its source—it had reached its maximum length for its effusion rate. The situation may be analogous to that of better-modeled ‘a‘ā flows, but since long-lived, low-effusion-rate pāhoehoe flows that are not limited in the extent they can travel (by the ocean, for example) are nearly unknown in nature, the June 27th flow represents a key example that should be the basis of future modeling.
Finally, the infiltration of lava into and downslope movement within existing ground cracks has not previously been observed to the extent seen at Kīlauea during August and September 2014. Lava disappeared from the surface for several days at a time. Small plumes of condensed steam coming from the forest were the only visible indication of flow advancement (Fig. 3B), although crack opening was indicated by nearby borehole tiltmeter and GPS instruments. The flow of lava through existing cracks should be considered in flow-path modeling, since such structures divert lava from its previous trajectory and may influence advance rate and longevity.
Future Impacts and Conclusions
The future of the June 27th lava flow is unclear. Although the 2014–2015 Pāhoa lava flow crisis is over, the lava flow remains active north of the ERZ and could advance downslope, especially if there is an increase in effusion rate. On the other hand, the 1983–present eruption has become consistently inconsistent, with new vents forming every few years (e.g., Orr et al., 2015a); a future reconfiguration could once more direct lava south to the ocean. The current ERZ eruption may also cease—an eventuality that cannot be forecast, but one that would obviously have profound implications for ongoing hazards (where would the next eruption occur?).
The June 27th flow has, thus far, provided numerous learning opportunities without causing widespread destruction. While many insights have been driven home by the flow—for example, the linkage between flow advance and summit pressurization, the interaction between lava flows and existing geologic structures, and the notorious leaky nature of lava tubes—a number of knowledge gaps have been put in the spotlight, including possible length-limiting factors for pāhoehoe flows and the need for better models of pāhoehoe lava advance rate. Lessons also extend to social science, where the response by HVO and the County of Hawai‘i highlighted the value of a coordinated and diverse approach to communicating uncertain hazards information and the importance of frequent interactions with people living and working in potential inundation areas. Indeed, the high level of involvement with the community may have helped to prevent the perception that HVO and the county were “crying wolf,” given that the crisis ultimately passed with little direct harm. These volcanological and sociological issues are the subject of a recently funded interdisciplinary National Science Foundation Hazards SEES project with many collaborating institutions (including HVO). Developing new tools based on the June 27th lava flow and similar experiences will be an important task for the next, inevitable, lava flow crisis, whether in Hawai‘i or elsewhere in the world.
Acknowledgments
We are grateful to the staff and officials of the County of Hawai‘i for their support and consistent collaboration on issues related to volcanic activity. In particular, we wish to acknowledge Hawai‘i County Civil Defense Administrator Darryl Oliveira, Mayor Billy Kenoi, and their staffs. Pilot David Okita was, as always, masterful and tireless in conducting flights to aid in monitoring and research activities. Our frequent coworkers from the University of Hawai‘i (both the Hilo and Mānoa campuses), including professors and students, provided important assistance in tracking the June 27th lava flow over time and evaluating hazards (Ken Hon and Cheryl Gansecki were especially close collaborators), and HVO greatly benefits from the many volunteers, like Ben Gaddis and David Dow, who assist with field, laboratory, and office work. Our thanks to Cynthia Gardner and two anonymous reviewers for their comments, which greatly improved the manuscript.
References Cited
- Anderson, K.R., Poland, M.P., Miklius, A., and Johnson, J.H., 2015, Episodic deflation–inflation events at Kīlauea Volcano and implications for the shallow magma system, in Carey, R.J., Cayol, V., Poland, M.P., and Weis, D., eds., Hawaiian Volcanoes, From Source to Surface: Washington, D.C., American Geophysical Union Geophysical Monograph 208, p. 229–250, doi: 10.1002/9781118872079.ch11.
- Callis, T., 2014, Work continues on Chain of Craters Road; plans are to smooth out path over lava instead of dig through: Hawaii Tribune-Herald, 2 Oct. 2014, http://hawaiitribune-herald.com/news/local-news/work-continues-chain-craters-road-plans-are-smooth-out-path-over-lava-instead-dig (last accessed Sept. 2015).
- Clague, D.A., Hagstrum, J.T., Champion, D.E., and Beeson, M.H., 1999, Kīlauea summit overflows; Their ages and distribution in the Puna District, Hawai‘i: Bulletin of Volcanology, v. 61, p. 363–381, doi: 10.1007/s004450050279.
- Favalli, M., Pareschi, M.T., Neri, A., and Isola, I., 2005, Forecasting lava flow paths by a stochastic approach: Geophysical Research Letters, v. 32, L03305, doi: 10.1029/2004GL021718.
- Gíslason, S.R., and 30 others, 2015, Environmental pressure from the 2014–15 eruption of Bárðarbunga volcano, Iceland: Geochemical Perspectives, v. 1, p. 84–93, doi: 10.7185/geochemlet.1509.
- González, P.J., Bagnardi, M., Hooper, A.J., Larsen, Y., Marinkovic, P., Samsonov, S.V., and Wright, J., 2015, The 2014–2015 eruption of Fogo volcano: Geodetic modelling of Sentinel-1 TOPS interferometry: Geophysical Research Letters, doi: 10.1002/2015GL066003.
- Harris, A.J.L., and Rowland, S.K., 2015, An updated framework for thermorheological simulations of channel-contained lava, in Carey, R.J., Cayol, V., Poland, M.P., and Weis, D., eds., Hawaiian Volcanoes, from Source to Surface: Washington, D.C., American Geophysical Union Geophysical Monograph 208, p. 457–481, doi: 10.1002/9781118872079.ch21.
- Kauahikaua, J., 2007, Lava flow hazard assessment, as of August 2007, for Kīlauea East Rift Zone Eruptions, Hawai‘i Island: U.S. Geological Survey Open-File Report 2007-1264, 9 p.
- Kauahikaua, J.P., and Tilling, R.I., 2014, Natural hazards and risk reduction in Hawai‘i, in Poland, M.P., Takahashi, T.J., and Landowski, C.M., eds., Characteristics of Hawaiian Volcanoes: U.S. Geological Survey Professional Paper 1801, p. 397–427, doi: 10.3133/pp180110.
- Kauahikaua, J., Cashman, K.V., Mattox, T.N., Heliker, C.C., Hon, K.A., Mangan, M.T., and Thornber, C.R., 1998, Observations on basaltic lava streams in tubes from Kilauea Volcano, island of Hawai‘i: Journal of Geophysical Research, v. 103, p. 27,303–27,323, doi: 10.1029/97JB03576.
- Kauahikaua, J., Sherrod, D.R., Cashman, J.V., Heliker, C., Hon, K., Mattox, T.N., and Johnson, J.A., 2003, Hawaiian lava-flow dynamics during the Pu‘u ’Ō’ō-Kupaianaha eruption: A tale of two decades, in Heliker, C., Swanson, D.A., and Takahashi, T.J., eds., The Pu‘u ’Ō’ō-Kupaianaha Eruption of Kilauea Volcano, Hawaii; The First 20 Years: U.S. Geological Survey Professional Paper 1676, p. 63–87.
- Keszthelyi, L., 1995, A preliminary thermal budget for lava tubes on the Earth and planets: Journal of Geophysical Research, v. 100, p. 20,411–20,420, doi: 10.1029/95JB01965.
- Moseley, M., 2014, Stalled lava eases Election Day fears for disaster-weary Puna: Honolulu Star-Advertiser, 3 Nov. 2014, http://www.staradvertiser.com/news/breaking/20141103_lava_update.html?id=281321051 (last accessed Sept. 2015).
- Nakaso, D., 2015a, Preparing for lava threat costs Big Isle at least $15M: Honolulu Star-Advertiser, 15 Apr. 2015, http://www.staradvertiser.com/newspremium/20150415__Preparing_for_lava_threat_costs_Big_Isle_at_least_15M.html?id=299814361 (last accessed Sept. 2015).
- Nakaso, D., 2015b, Life on the edge: Honolulu Star-Advertiser, 23 Feb. 2015, http://www.staradvertiser.com/newspremium/20150223__PAHOA_in_the_shadow_of_kilauea_LIFE_ONTHEEDGE_.html?id=293603581 (last accessed Sept. 2015).
- Orr, T.R., Poland, M.P., Patrick, M.R., Thelen, W.A., Sutton, A.J., Elias, T., Thornber, C.R., Parcheta, C., and Wooten, K.M., 2015a, Kīlauea’s 5–9 March 2011 Kamoamoa fissure eruption and its relation to 30+ years of activity from Pu‘u ‘Ō ‘ō, in Carey, R.J., Cayol, V., Poland, M.P., and Weis, D., eds., Hawaiian Volcanoes, From Source to Surface: Washington, D.C., American Geophysical Union Geophysical Monograph 208, p. 393–420, doi: 10.1002/9781118872079.ch18.
- Orr, T.R., Bleacher, J.E., Patrick, M.R., and Wooten, K.M., 2015b, A sinuous tumulus over an active lava tube at Kīlauea Volcano: Evolution, analogs, and hazard forecasts: Journal of Volcanology and Geothermal Research, v. 291, p. 35–48, doi: 10.1016/j.jvolgeores.2014.12.002.
- Patrick, M.R., Anderson, K.R., Poland, M.P., Orr, T.R., and Swanson, D.A., 2015a, Lava lake level as a gauge of magma reservoir pressure and eruptive hazard: Geology, v. 43, p. 831–834, doi: 10.1130/G36896.1.
- Patrick, M.R., Kauahikaua, J., Orr, T.R., Davies, A., and Ramsey, M., 2015b, Operational thermal remote sensing and lava flow monitoring at the Hawaiian Volcano Observatory, in Harris, A.J.L., De Groeve, T., Garel, F., and Carn, S.A., eds., Detecting, Modelling and Responding to Effusive Eruptions: Geological Society of London Special Publication 426, doi: 10.1144/SP426.17.
- Poland, M.P., 2014, Time-averaged discharge rate of subaerial lava at Kīlauea Volcano, Hawai‘i, measured from TanDEM-X interferometry: Implications for magma supply and storage during 2011–2013: Journal of Geophysical Research, v. 119, p. 5464–5481, doi: 10.1002/2014JB011132.
- Stewart, C., 2015, Flow suppressed Puna real estate market: Hawaii Tribune-Herald, 27 June 2015, p. A1, A5, http://www.hawaiitribune-herald.com/news/local-news/flow-suppressed-puna-real-estate-market (last accessed Sept. 2015).
- Walker, G.P.L., 1973, Lengths of lava flows: Royal Society of London Philosophical Transactions, ser. A, v. 274, p. 107–118, doi: 10.1098/rsta.1973.0030.