
Page 7 - gt1605
P. 7
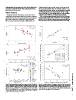
confounded by local vineyard practices. Wine pH also did not show                depth determined 57%–59% of the variance in wine pH, but in
any relation to grape Brix or wine total acidity, alcohol content,               other years, it determined only 11%–30% of the variance. A very
price per bottle, or harvest date.                                               strong correlation in 2009 and 2011 was also found between grape
                                                                                 and wine pH, with lesser correlations for 2008 and not enough
VINTAGE VARIATION                                                                data for 2010 (Fig. 4A). Thus, vintage differences reflect growing
                                                                                 conditions and not differences in winemaking techniques.
  Vintages of wines were kept separate as a part of the experi-
mental design to keep seasonal differences in weather constant for                 There is a very strong relationship between the size of the grape
individual series of wines compared, but there is a strong vintage               harvest and the strength of the correlation between soil and wine
effect in the coefficient of correlation (r2) of the relationship                pH (Fig. - 4B). The size of the harvest was measured two different
between wine pH and soil pH or depth. In 2009, soil pH and                       ways with similar results: (1) total Pinot Noir harvest from a single

Figure 3. Relationships between wine pH and minimum soil pH (A) and depth        Figure 4. Correlation between pH of grapes at harvest and pH of wine in the    GSA TODAY | www.geosociety.org/gsatoday
to base of clayey (Bt or Bw) horizon (B) in the 2009 vintage Pinot Noir wine     2009 vintage Pinot Noir from the Willamette Valley, Oregon (A), between
from the Willamette Valley, Oregon, USA. These correlations are all highly       variance of coefficient of correlation between wine-soil pH and grape harvest
significant using an ANOVA F test. One relationship is inverse and the other     size for vintages 2008–2011 (B), and between Wine Advocate vintage ranking
direct, because minimum soil pH and depth of clayey horizon are inversely        and local October precipitation for that vintage (C).
correlated (C). Comparable correlations for three other vintages are in the GSA
Supplemental Data Repository [see footnote 1].

                                                                                                                                                                7