
Page 7 - i1052-5173-27-6
P. 7
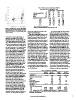
Table 2. Results of post-hoc analyses and ANCOVA

                                                                            F[3, 589] = 17.55, p < 0.01, adj. R2 = 0.40

                                                                                          pre-intervention      post-intervention
                                                                                    n mean* s.d.*                 mean s.d.

                                                          3 AR field trips (ARFTs) 218 48.8 5.3                          58.1 9.3

                                                          2 ARFTs                   55 48.6 4.7                          55.0 11.0

                                                          1 ARFT                    217 47.0 5.1                         51.6 10.0

                                                          control                   104 47.2 5.7                         50.0 11.4

                                                          comparison of completed ARFTs contrast std. err.               t P > |t|

                                                                    1 vs 0                          1.68 0.98            1.72 0.51

                                                                    2 vs 0                          3.35 1.37            2.45 0.09

                                                                    3 vs 0                          6.26 0.98            6.38 0.00

                                                                    2 vs 1                          1.66 1.24            1.34 1.00

                                                                    3 vs 1                          4.57 0.79            5.77 0.00

                                                                    3 vs 2                          2.91 1.24            2.36 0.11

                                                          ARFTs—Artificial reality field trips.

                                                          *Mean and standard deviation (s.d.) on a scale from 0–70.

Figure 2. Results of pre- and post-intervention      theoretically important variables for the        In an effort to determine what predicts
Geoscience Interest Survey scores for students       nested regression analyses.                    students’ interest in the geosciences, we
having completed zero (n = 104), one (n = 217),                                                     ran a hierarchical linear model (HLM).
two (n = 55), or three (n = 218) AR field trip mod-    First-order examination of the pre- and      Expanding on the basic idea of regression
ules (see Table 1).                                  post-intervention GeoIS scores shows a         with a set of predictor variables and an
                                                     trend of increased student interest across     outcome, HLM accounts for data that are
matrix of the variables; (2) running an              all participants (Fig. 2). There is a dis-     nested (Raudenbush and Bryk, 2001). In
analysis of covariance (ANCOVA) to                   tinctly greater increase in student interest   this case, students came from different
determine the degree of impact of the AR             among those participants who completed         schools with different instructors and dif-
field trips on student interest; and (3) run-        two and three AR field trips over those        ferent regional geologic features that can
ning a hierarchical linear model (HLM) to            who completed only one or were in control      play a role in curriculum decisions. The
determine the predictors of student interest.        groups (Fig. 2). In order to test for differ-  HLM adjusted for school differences by
                                                     ences empirically, we used an Analysis of      using two levels (site and student) with six
  We assessed the inter-item reliability of          Covariance (ANCOVA). As recommended            predictors of geoscience interest: (1) GeoIS
the GeoIS by means of a Cronbach’s alpha             when students are not randomly assigned        pre-intervention score; (2) number of AR
analysis. While test–re-test reliability             (Campbell and Stanley, 1963), we con-          field trips completed; (3) site classification;
between pre- and post-tests was a possibil-          trolled for preexisting differences by using   (4) gender; (5) race; and (6) STEM major.
ity, we felt that inter-item reliability was         the pre-test as a covariate. The results of    After a null model (Table 3) that ignored
more insightful given that everyone was              the ANCOVA (Table 2) indicate that the         the predictors, subsequent models explored
exposed, and change was anticipated.                 number of field trips completed does play a    both student and site level variables.
Positive values for alpha (up to a max of            role in student interest: F(3, 589) = 17.55,   Goodness of fit (AIC and BIC) suggests that
1.00) indicate that there are greater differ-        p <0.01. Pairwise comparisons in the same      a parsimonious model with only signifi-
ences of opinion between learners. The               table suggest that students completing         cant predictors is a strong fit for these data.
observed values of 0.91 for the pre-inter-           three AR field trips were significantly        The results of the parsimonious model
vention and 0.93 for the post-intervention           more interested in learning geoscience in      (Table 3) indicate that there are three strong
GeoIS instrument indicate a high level of            the future than students completing one or     predictor variables for student interest
reliability (Murphy and Davidshofer,                 zero AR field trips.
1988). Given the established nature and
prior research conducted with the MSLQ,                                     Table 3. Results from HLM modeling
we chose to use a confirmatory factor
analysis to assess instrument validity of                                           Model 0         Model 1     Model 2                Model 3
the GeoIS. The fifteen GeoIS items                                                                              complete            parsimonious
coalesced onto a single factor based on 874                                         null model student level
observations with loadings ranging from
0.17 to 0.83. Based on this combination of           Student Level
observations and loading values, the
adapted MSLQ instrument appears to                   Constant                       15.10           0.97        5.78E-19            4.64E-18
measure a single construct at a significant
level (Stevens, 1999). The correlation               GeoIS score pre-intervention                   1.07 1.08 1.08
matrix (Data Repository Table S2 [see                Gender                                         0.79 0.78
footnote 1]) revealed four statistically sig-        Race                                           0.29 –0.55
nificant variables: (1) the pre-intervention
survey score; (2) institution; (3) STEM              STEM major                     101.94           3.58                 3.09       2.18
major; and (4) number of AR field trips              No. of ARFTs complete                           2.00                 1.47       1.72
completed. Despite a lack of statistical sig-        Site classification                             2.06                 1.31
nificance, race and gender were kept as                                                             65.98                65.09      65.47
                                                       Residual

                                                     Site Level

                                                     GeoIS score pre-intervention                                        1.50 1.71

                                                     AIC                            5390.09 4169.36                  4158.09        4169.52

                                                     BIC                            5403.83 4208.78                  4201.89        4200.20

                                                     AIC—goodness of fit; ARFTs—augmented reality field trips; BIC—goodness of fit; GeoIS—

                                                     geoscience interest survey; HLM—hierarchical linear modeling; STEM—Science, technology,

                                                     engineering, and mathematics.

                                                     www.geosociety.org/gsatoday                                                                     7