
Page 66 - i1052-5173-28-5
P. 66
Charting the Geosciences with Google Ngram Viewer
Danita S. Brandt, Department of Earth and Environmental Geosciences, Michigan State University, East Lansing, Michigan 48824,
USA, brandt@msu.edu
INTRODUCTION available at www.culturomics.org and was followed by volumes two and three in
www.ngrams.googlelabs.com. 1832 and 1833, respectively. The N-gram
Frequency of mention in books can be frequency chart supports the hypothesis
used to trace the evolution of a discipline, CAVEATS TO USING THE CORPUS that Lyell’s books contributed to an
from the first recorded use of the word or increase in the frequency of the unigram
phrase to its current standing, as measured Problems with the unfiltered use of the “geology”; the conclusion that Lyell’s work
by the number of books that include the Google Books corpus are well-documented, had a major impact on the growth of geol-
phrase. Ngram Viewer, the tool developed including errors introduced during optical ogy is supported independently by histori-
by a team at Google Books (Michel et al., scanning and entering metadata (Nunberg, ans of our discipline (Rudwick, 2010).
2011) places a database (“corpus”) of >500 2009). Pechenick et al. (2015) described
billion words at the disposal of its users limits to inferring cultural and linguistic N-gram frequency of “micropaleontol-
(http://books.google.com/ngrams). Here I evolution from the Google N-gram corpus, ogy” reached a maximum in the early
describe how this tool can be used to including the problem of the burgeoning 1950s, coincident with that decade’s
examine patterns suggested by qualitative number of scientific texts since 1990, “petroleum” boom, and reflects the well-
ideas about the intellectual development of which skews the results toward academic documented connection between micro-
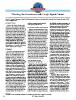
the geosciences. An example of the Ngram usage of N-grams and is therefore less biostratigraphy and petroleum exploration
Viewer output is given in Figure 1. reflective of cultural context. However, if (Haq and Boersma, 1998). However, not all
the user’s purpose is to trace the history of possible correlations are easily tested using
N-GRAMS a scientific discipline rather than a cultural Ngram Viewer; an attempt to chart the
phenomenon, as the purpose is here, the bias N-grams “micropaleontology” and “petro-
An N-gram is a contiguous string of n Pechenick et al. (2015) described skews in a leum” on the same graph returned a display
items from a given sequence of text or constructive direction. Because the database in which the line tracing the frequency of
speech. A 1 gram (also known as a uni- consists of books only, rather than journal “micropaleontology” was indistinguish-
gram) is a string of characters uninter- articles, N-gram results might lag the intel- able from the x-axis; the frequency of the
rupted by a space, e.g., “trilobite” or lectual development of a discipline. N-gram “petroleum” swamped “micropa-
“3.14159.” An N-gram is a sequence of leontology.” The corpus is also sensitive to
1 gram, e.g., “trilobite extinction” (2 gram APPLICATION TO THE N-gram size and word order; the trigram
or bigram), and “Michigan State University” GEOLOGICAL SCIENCES “extinction of trilobites” successfully
(3 gram or trigram). N-grams are used by returned results; a query for “trilobite
computer scientists and computational lin- Ngram Viewer is useful for suggesting extinction” returned no N-grams. Although
guists for text mining and natural language testable hypotheses by identifying correla- Ngram Viewer does not allow for easy
processing (Jurafsky and Martin, 2014). tions. Two important caveats to keep in comparison of N-grams with wildly differ-
Google Books, a service of search-engine mind when using Ngram Viewer are, as in ent occurrence rates, this obstacle can be
giant Google Inc., has amassed a database any analysis, correlation does not necessar- overcome by downloading and replotting
of more than 25 million scanned books. ily indicate causation, and, as with any the Ngram Viewer data using programs
From this resource, a subset of over five online resource (Wikipedia, for example), such as R.
million books, chosen for the quality of Ngram Viewer provides a starting point to
their optical scan and metadata (e.g., date of stimulate further investigation, not an end in Cause-and-effect is suggested by the
publication), comprises the corpus of Google itself. Here, in approximate chronological graph of “geosynclines” and “plate tecton-
Ngram Viewer. Currently, Ngram Viewer is order, are three examples of Ngram Viewer ics” (Fig. 1). The graph traces the displace-
restricted to a maximum word string length searches drawn from geological topics cho- ment of the older “geosynclines” paradigm
of n = 5 (five-grams), and counts only sen to illustrate the potential and the limita- for explaining crustal tectonics by the
N-grams that occur at least 40 times in the tions of these data. Search terms and phrases emergence of “plate tectonics.” The dra-
corpus. The data consist of books published (the N-grams) are enclosed in quotes. matic shift from “geosynclines” to “plate
from the 1500s to 2000, and includes chil- tectonics” occurred in the mid-1970s, as
dren’s literature, trade, and other books but The frequency of the unigram “geology” plate tectonic theory supplanted the pre-
no journal articles. The full data set is shows an increase at 1830, coincident with tectonic explanation of crustal dynamics
publication of the first volume of Charles and made its way into textbooks. The
Lyell’s Principles of Geology. Volume one apparent causal connection between the
GSA Today, v. 28, doi: 10.1130/GSATG348GW.1. Copyright 2018, The Geological Society of America. CC-BY-NC.
66 GSA Today | May 2018