
Page 29 - i1052-5173-30-8
P. 29
lished data (Thiry et al., 2012) from novice of thinking and working like a scientist, the ACKNOWLEDGMENTS
(≤1 year) and experienced (>1 year) under- MS-CURE group showed high Likert scores Funding was provided by NSF DUE 1525590. We
graduate researchers to the MS-CURE stu- that are similar to those of experienced stu- thank two anonymous reviewers for comments that
dents. Students in the comparison groups dents, although statistically indistinguish- helped improve the manuscript.
participated in apprentice-style UREs pre- able from novice students. The highest gains REFERENCES CITED
dominated by bioscience disciplines at two were in perceived improvements in problem Auchincloss, L.C., Laursen, S.L., Branchaw, J.L.,
research-intensive universities. Those partici- solving and probably reflect the real-world Eagan, K., Graham, M., Hanauer, D.I., Lawrie, G.,
pants were competitively selected, received nature of the research project. McLinn, C.M., Pelaez, N., Rowland, S., Towns, M.,
stipends, and had access to supplemental Trautmann, N.M., Varma-Nelson, P., Weston, T.J.,
and Dolan, E.L., 2014, Assessment of course-based
enrichment activities as part of their experi- SYNERGISTIC BENEFITS undergraduate research experiences: A meeting
ence. Therefore, the comparison groups likely Students of lower socioeconomic status, report: CBE Life Sciences Education, v. 13, p. 29–
reflect best-case URE outcomes. In contrast, first-generation students, and underrepre- 40, https://doi.org/10.1187/cbe.14-01-0004.
our MS-CURE reached a broad cross section sented groups often are unaware of the National Academies of Science, Engineering, and
of students who completed their research as benefits of research and thus may not apply Medicine (NASEM), 2017, Undergraduate Re-
search Experiences for STEM Students: Successes,
part of graded, required courses that included for competitive research opportunities Challenges, and Opportunities: Washington, D.C.,
other topics and exams and a higher student- (NASEM, 2017). Extending the traditional National Academies Press, 279 p., https://doi org/
.
faculty ratio, which can discourage interest in CURE into a curriculum-embedded experi- 10.17226/24622.
research (Auchincloss et al., 2014). Summa, L., Keane, C., and Mosher, S., 2017, Meeting
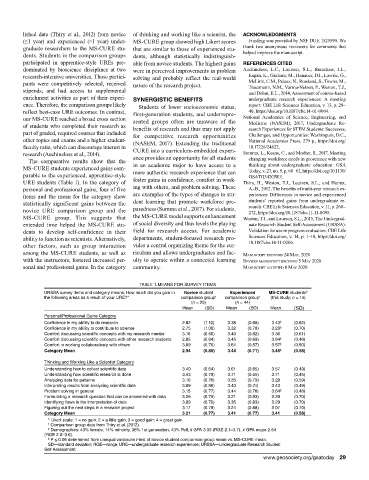
The comparative results show that the ence provides an opportunity for all students changing workforce needs in geoscience with new
MS-CURE students experienced gains com- in an academic major to have access to a thinking about undergraduate education: GSA
Today, v. 27, no. 9, p. 60–61, https://doi.org/10.1130/
parable to the experienced, apprentice-style more authentic research experience that can GSATG342GW.1.
URE students (Table 1). In the category of foster gains in confidence, comfort in work- Thiry, H., Weston, T.J., Laursen, S.L., and Hunter,
personal and professional gains, four of five ing with others, and problem solving. These A.-B., 2012, The benefits of multi-year research ex-
items and the mean for the category show are examples of the types of changes to stu- periences: Differences in novice and experienced
statistically significant gains between the dent learning that promote workforce pre- students’ reported gains from undergraduate re-
search: CBE Life Sciences Education, v. 11, p. 260–
novice URE comparison group and the paredness (Summa et al., 2017). For students, 272, https://doi.org/10.1187/cbe.11-11-0098.
MS-CURE group. This suggests that the MS-CURE model supports enhancement Weston, T.J., and Laursen, S.L., 2015, The Undergrad-
extended time helped the MS-CURE stu- of social diversity and thus levels the playing uate Research Student Self-Assessment (URSSA):
dents to develop self-confidence in their field for research access. For academic Validation for use in program evaluation: CBE Life
.
ability to function as scientists. Alternatively, departments, student-focused research pro- Sciences Education, v. 14, p. 1–10, https://doi org/
other factors, such as group interaction vides a central organizing theme for the cur- 10.1187/cbe.14-11-0206.
among the MS-CURE students, as well as riculum and allows undergraduates and fac- Manuscript received 24 Mar. 2020
with the instructors, fostered increased per- ulty to operate within a connected learning revised Manuscript received 5 May 2020
sonal and professional gains. In the category community. Manuscript accepted 8 May 2020
TABLE 1. MEANS FOR SURVEY ITEMS
URSSA survey items and category means. How much did you gain in Novice student Experienced MS-CURE students #
†
†
the following areas as a result of your URE?* comparison group comparison group (this study; n = 14)
(n = 29) (n = 44)
Mean (SD) Mean (SD) Mean (SD)
Personal/Professional Gains Category
Confidence in my ability to do research 2.82 (1.10) 3.38 (0.68) 3.43 § (0.62)
Confidence in my ability to contribute to science 2.75 (1.00) 3.32 (0.78) 3.29 § (0.70)
Comfort discussing scientific concepts with my research mentor 3.18 (0.60) 3.40 (0.82) 3.36 (0.61)
Comfort discussing scientific concepts with other research students 2.85 (0.84) 3.45 (0.69) 3.64 § (0.48)
Comfort in working collaboratively with others 3.09 (0.70) 3.64 (0.57) 3.57 § (0.50)
Category Mean 2.94 (0.85) 3.44 (0.71) 3.46 § (0.58)
Thinking and Working Like a Scientist Category
Understanding how to collect scientific data 3.40 (0.64) 3.61 (0.65) 3.57 (0.49)
Understanding how scientific research is done 3.43 (0.79) 3.71 (0.55) 3.71 (0.45)
Analyzing data for patterns 3.10 (0.76) 3.35 (0.79) 3.29 (0.59)
Interpreting results from analyzing scientific data 3.09 (0.86) 3.40 (0.74) 3.43 (0.49)
Problem solving in general 3.15 (0.77) 3.44 (0.76) 3.64 § (0.48)
Formulating a research question that can be answered with data 3.26 (0.75) 3.21 (0.93) 3.29 (0.70)
Identifying flaws in the interpretation of data 3.09 (0.76) 3.35 (0.83) 3.29 (0.70)
Figuring out the next steps in a research project 3.17 (0.79) 3.24 (0.88) 3.07 (0.70)
Category Mean 3.21 (0.77) 3.41 (0.77) 3.41 (0.58)
* Likert scale: 1 = no gain; 2 = a little gain; 3 = good gain; 4 = great gain.
† Comparison group data from Thiry et al. (2012).
# Demographics: 43% female, 14% minority, 36% 1st generation, 43% Pell, x GPA 3.03 (RGE 2.1–3.7), x GPA major 2.64
(RGE 2.0–3.6).
§ P ≤ 0.05 determined from unequal variances t-test of novice student comparison group mean vs. MS-CURE mean.
SD—standard deviation; RGE—range; URE—undergraduate research experiences; URSSA—Undergraduate Research Student
Self-Assessment.
www.geosociety.org/gsatoday 29