
Page 6 - i1052-5173-32-11
P. 6
entity types. For example, IODP Site 1340 CLASSIFYING THE SUPPORT FOR Multi-Layer Perceptron (henceforth, MLP)
(IODP stands for Integrated Ocean Discovery THE RESEARCH QUESTION OF that operates on the same features as the
Program) refers to a certain location, but the INTEREST above SVM variants. Last, we implemented
recognizer identified only 1340, and classi- Even though these spatial and temporal an ensemble strategy that combines the out-
fied it incorrectly as a DATE. The recognizer expressions are important to contextualize puts of these three individual models.
missed the term Pliocene, which means “the the findings of a publication, they provide no To prevent the classifiers from overfitting
geologic time scale that extends from 5.333 information on our key research question: on the training data, we used L2 regulariza-
million to 2.58 million years B.P.” Ma in whether volcanism affected climate change. tion when training the statistical classifiers
geosciences articles usually means million To make a prediction of whether the given that support it (i.e., SVM, NB-SVM, and
years ago, but the CoreNLP NER did not paper supports or negates the relationship MLP classifiers). Intuitively, regularization
identify it as TIME. between volcanism and climate change, it is aims to “zero out” the features that are not
To recognize expressions that were not necessary to build a machine learning classi- critical to the task, which reduces the
identified by CoreNLP or Spacy, we used the fier that infers if the observation is supported potential of overfitting, or “hallucinating a
Odin event extraction framework and rule (or not) from the text of these publications. classifier” (Domingos, 2015). All docu-
language (Valenzuela-Escárcega et al., 2016); Among the wide variety of text classifica- ment classification routines are detailed in
henceforth, Odin), and added custom rules to tion methods, in this work we focused on four supplemental document 3 (see footnote 1).
capture geoscience-specific expressions. In methods that have been shown to perform
particular, we developed rules to capture: well for text classification, including “tradi- Data Annotation
tional” statistical methods as well as deep Data annotation was performed via
Temporal Information learning. To represent the traditional “camp,” FindingFive. Two hundred papers were ran-
As mentioned, initially we utilized the we used Support Vector Machines (Cortes domly chosen from the set of 1157 down-
named entity recognition tool in Stanford’s and Vapnik, 1995) and Naïve-Bayes SVMs loaded papers, and then title, abstract, intro-
CoreNLP (Manning et al., 2015); hence- (NB-SVMs) (Wang and Manning, 2012). For duction, conclusion/discussion sections of
forth, CoreNLP) to identify time informa- the deep learning field, we implemented a 200 papers were presented to the two
tion. However, since CoreNLP was trained
on general text data, it does not recognize
geological temporal expressions, such as A
Paleocene or Jurassic. In addition, in geo-
sciences papers, there were abbreviations
such as M.y.r. and M.a., which mean mil-
lions of years (duration), and million years
ago (absolute time). Thus, we wrote cus-
tom rules to recognize geological temporal
expressions and built a custom time normal-
izer to convert actual times (e.g., 170 M.y.r.,
or 1.5 million years ago) to relevant geologi-
cal time scale (e.g., Jurassic, Quaternary)
(see supplemental document 1 for specific
1
details on these rules).
Site Information
Similar to temporal information, there
were domain-specific spatial expressions
that could not be captured by existing NERs
such as Stanford’s CoreNLP. Further, some
of these expressions did not have any infor- 7
mation about the actual locations that they
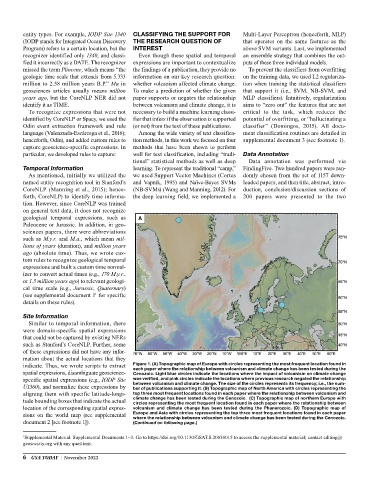
indicate. Thus, we wrote scripts to extract Figure 1. (A) Topographic map of Europe with circles representing the most frequent location found in
spatial expressions, disambiguate geoscience- each paper where the relationship between volcanism and climate change has been tested during the
Cenozoic. Light blue circles indicate the locations where the impact of volcanism on climate change
specific spatial expressions (e.g., IODP Site was verified, and pink circles indicate the locations where previous research negated the relationship
U1360), and normalize these expressions by between volcanism and climate change. The size of the circles represents its frequency; i.e., the num-
ber of publications supporting it. (B) Topographic map of North America with circles representing the
aligning them with specific latitude-longi- top three most frequent locations found in each paper where the relationship between volcanism and
tude bounding boxes that indicate the actual climate change has been tested during the Cenozoic. (C) Topographic map of northern Europe with
circles representing the most frequent location found in each paper where the relationship between
location of the corresponding spatial expres- volcanism and climate change has been tested during the Phanerozoic. (D) Topographic map of
sions on the world map (see supplemental Europe and Asia with circles representing the top three most frequent locations found in each paper
where the relationship between volcanism and climate change has been tested during the Cenozoic.
document 2 [see footnote 1]). (Continued on following page.)
1 Supplemental Material. Supplemental Documents 1–3. Go to https://doi.org/10.1130/GSAT.S.20030015 to access the supplemental material; contact editing@
geosociety.org with any questions.
6 GSA TODAY | November 2022