
Page 7 - i1052-5173-32-11
P. 7
B words, the two annotators somewhat agreed
on whether a given paper supported or
negated the observation that “volcanism
affected the climate change.” This “moder-
ate” agreement is often found in this type of
annotation task since the research question
itself is quite complex and only part of the
papers (e.g., abstract, introduction, conclu-
sion) was provided to the annotators.
Classification of Results
We evaluated the quality of the proposed
classifiers that were trained on the annota-
tions by comparing the micro-F1 score cal-
culated using 10-fold cross validation. More
formally, we collected the algorithm’s pre-
C dictions on each test partition, and calcu-
lated the micro-F1 score (see supplemental
material, including a formal definition of
these measures in document 3) from all
these predictions.
In these experiments, we observed that
the MLP classifier outperforms both the
NB-SVM and SVM classifiers, and that the
ensemble approach does not improve over
the performance of the MLP method (see
supplemental document 3 for all these
results). Informed by these results, we used
the MLP model to classify all the 957
remaining papers in the collected data set
on whether they supported/negated or were
unrelated to the research question at hand.
D
Aggregation of Results for
Visualization
With the two components described
above that (a) place a scientific finding in
its proper geospatial and temporal context,
and (b) identify if publications support or
negate the research question at hand, we
can aggregate and visualize results at
scale. To further simplify the visualiza-
tions, we used the geopy (https://pypi.org/
project/geopy/) Python library to convert
IODP sites to latitudes and longitudes, and
we converted the identified specific geo-
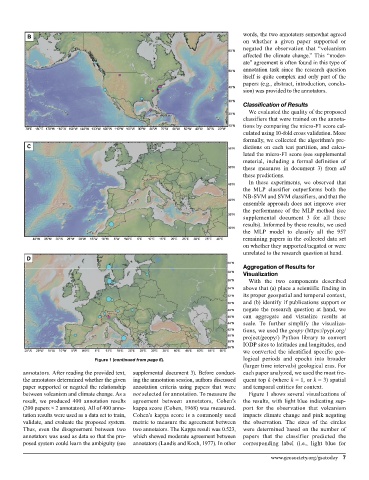
Figure 1 (continued from page 6). logical periods and epochs into broader
(larger time intervals) geological eras. For
annotators. After reading the provided text, supplemental document 3). Before conduct- each paper analyzed, we used the most fre-
the annotators determined whether the given ing the annotation session, authors discussed quent top k (where k = 1, or k = 3) spatial
paper supported or negated the relationship annotation criteria using papers that were and temporal entities for context.
between volcanism and climate change. As a not selected for annotation. To measure the Figure 1 shows several visualizations of
result, we produced 400 annotation results agreement between annotators, Cohen’s the results, with light blue indicating sup-
(200 papers × 2 annotators). All of 400 anno- kappa score (Cohen, 1968) was measured. port for the observation that volcanism
tation results were used as a data set to train, Cohen’s kappa score is a commonly used impacts climate change and pink negating
validate, and evaluate the proposed system. metric to measure the agreement between the observation. The sizes of the circles
Thus, even the disagreement between two two annotators. The Kappa result was 0.523, were determined based on the number of
annotators was used as data so that the pro- which showed moderate agreement between papers that the classifier predicted the
posed system could learn the ambiguity (see annotators (Landis and Koch, 1977). In other corresponding label (i.e., light blue for
www.geosociety.org/gsatoday 7