
Page 7 - i1052-5173-27-2
P. 7
AB
CD
EF
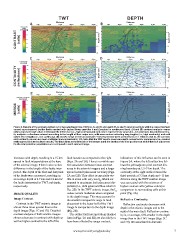
Figure 2. Results of the analysis carried out in two-way travel time (TWT) (A, C, and E) and depth (B, D, and F) seismic sections with the respective fault
spread superimposed (outlier limits marked with dashed lines; quartiles 1 and 2 marked in continuous lines). (A) and (B) contrast analysis—warm
colors represent high values in interquartile difference (i.e., high contrast) and cold colors represent low values (i.e., low contrast). (C) and (D) continu-
ity analysis—reflections colored according to the length of their major axis, with warm colors indicating long lengths (i.e., high continuity) and cold
colors short length (i.e., low continuity). (E) and (F) merge of the two analyses—the results have been combined in a 1:1 relation; that is, the contrast
and continuity values have been multiplied and normalized to 100. Note that the TWT results have been depth-converted for comparison (i.e., located
at the same point) to the depth results. The black lines at the left side of the images mark the depths of the nine positions at which the fault placement
for the interpretation populations was computed in each seismic image.
increases with depth, resulting in a 15-km fault location as compared to the right indications of this influence can be seen in
spread in fault interpretations at the base (Figs. 2A and 2B). There is a visible spa- Figure 2A, where the left outlier line fol-
of the seismic image. There is also a clear tial association between lower contrast lows the yellow/green pixel contrast bin-
difference in the length of the faults inter- areas in the seismic imagery and a larger ning boundary at 2.5–7 km depth. The
preted. The depth of the first and last point spread in fault placement certainty (Figs. convexity of the right outlier toward the
of the faults were measured, resulting in 2A and 2B). This effect is especially vis- third quartile at 3.5 km depth and ~15 km
an average depth of 4.7 km and 6.6 km for ible in areas with very low IQ, which cor- distance along the TWT seismic image
the faults interpreted in TWT and depth, respond to maximum fault placement dis- was associated with the existence of
respectively. persion (i.e., dark green and blue colors in higher contrast cells (yellow colors) in
Fig. 2B). In the TWT seismic image, the IQ comparison to surrounding cells at this
IMAGE QUALITY values remain moderate when compared point (Fig. 2A).
to the depth image. This may account for
Image Contrast the smaller interquartile range in fault Reflection Continuity
placement in the lower half of the TWT
Contrast in the TWT seismic image is image in comparison to the depth image Reflection continuity decreases with
almost three times greater than in the (Fig. 2B). depth in the seismic images and to the
depth image (Figs. 1C and 1D). Detailed right of the main fault. Reflection continu-
contrast analysis of both seismic images The outlier fault interpretations (dashed ity is, on average, 63% smaller in the depth
shows a decrease in contrast with depth as lines in Figs. 2A and 2B) are also likely to image than in the TWT image (Figs. 2C
well as higher contrast to the left of the have been affected by image contrast; and 2D). We associate this dramatic
www.geosociety.org/gsatoday 7