
Page 7 - i1052-5173-28-3-4
P. 7
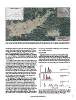
Figure 3. 10Be concentration (105 atoms g−1) of Hickory Run boulders and tors; red dots indicate higher 10Be concentration; green dots indicate lower.
Insets show location of tors (Fig. 1C) relative to the main boulder field and positive correlation between 10Be concentration and downslope distance.

concentrations within the main body of the field become increas-      t-test). In part, this decrease reflects longer near-surface histo-
ingly different with distance between boulders (Fig. DR2 [see         ries of boulders downfield.
footnote 1]). Boulders upfield (n = 10) include the two lowest mea-   DISCUSSION
sured 10Be concentrations (0.4 ± 0.07 × 10⁶ atoms g−1; Fig. 4)
whereas downfield boulders contain much more 10Be, averaging            Cosmogenic nuclide measurements, when considered along
2.1 ± 0.6 × 10⁶ atoms g−1. Concentrations on ridgeline tors and in    with field observations, provide a means to infer how boulder
the southeastern sub-field tend to be lower than the main body of     fields change over time. For example, boulders at Hickory Run are
the field (Fig. 4).                                                   more rounded, smaller, and thus more weathered downfield than
                                                                      upfield; the downfield increase in 10Be concentration suggests the
  Our measurements of boulder HR10 and of the clasts below it         importance of near-surface residence time in physical and chemical
are inconsistent with simple exposure in place (Fig. 2) and imply
movement and flipping of the boulder. The measured 10Be con-          Figure 4. Summed probability plot of 10Be concentrations (A) in tors, (B) of
centration in sample HR10B (from the underside of the boulder,        the three furthest upslope boulder transects, and (C) of the two furthest
0.39 m below the surface) is 170% of what it would be if the          downslope. Red curves represent single 10Be measurements with 2σ
boulder had received all of its exposure as currently oriented        internal error; the black line represents the sum of all samples.
(Table DR1 [see footnote 1]). Clasts C1, C2, and C3 have more
than triple the expected 10Be concentration than if they had been
continuously irradiated underneath the boulder; all three have
higher concentrations than the sample from the top of the boul-
der. The boulder and clasts could not have been exposed and
irradiated only in their current position.

  Concentrations of 26Al range from 3.00 to 19.3 × 10⁶ atoms g−1
(n = 25), and correlate well with 10Be measurements (r2 = 0.99).
26Al/10Be ratios range from 5.4 to 7.3. When plotted on a two-
isotope diagram (Fig. 5), all but five samples fall below the
upper constant exposure line, consistent either with exposure
followed by erosion (between the upper and lower lines), with at
least one episode of burial after initial exposure, or with expo-
sure under cover followed by exhumation. Samples from the top
of the field (n = 10) have an average 26Al/10Be of 6.61 ± 0.46,
whereas those from the bottom of the field (n = 11) have an aver-
age 26Al/10Be of 5.96 ± 0.31 (separable at 95% confidence, Student’s

www.geosociety.org/gsatoday                                                                                                                             7