
Page 8 - i1052-5173-28-3-4
P. 8
LGM Illinoian A
Hickory Run Boulder Field
(this study, n=52)
B
Regional Quartzite Bedrock Outcrops
(Portenga et al. 2013, n=39)
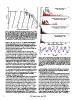
Probability C
Regional Sandstone Bedrock Outcrops
(Portenga et al. 2013, n=38)
Figure 5. Measured 26Al/10Be plotted against measured 10Be concentra- Global Boulder Field Samples D
tions (n = 25). Plot is based on a local production rate of six atoms g−1 y−1 (Multiple Authors, n=40)
and surface production ratio of 7.0 (Argento et al., 2013). The thick black
line indicates constant surface exposure, and the line beneath it marks
the end of the “steady erosion envelope”; points beneath this envelope
have had at least one period of burial or shielding during or after expo-
sure. Thin lines represent the trajectory that a sample would follow if bur-
ied, and dotted lines indicate burial isochrons of 0.5, 1.0, and 1.5 m.y.
assuming surface exposure followed by deep burial (top to bottom).
boulder weathering. The decrease in 26Al/10Be ratios downfield 0 100 200 300 400 500 600
indicates that boulders there have experienced more complex Minimal Total Exposure History (ka) 15
exposure histories, including erosion, exhumation, burial, and/or 5
flipping, than upfield boulders. Changes in boulder long-axis cool δ O warm 3 9 11 13 E
alignment downfield likely indicate at least some downfield, and 7
thus downslope, boulder transport. 17
Multiple cosmogenic measurements on a single boulder 4 6 8 10 12 14 16
(HR10) reveal more about boulder history and boulder field pro- 2 200
cesses. Measurements of samples from the top and bottom of the 300 400 500 600
boulder, as well as the underlying clasts, demonstrate that it has 0 100 Age (ka)
changed position and not simply weathered in place. Although
there is no unique solution, this disparity in concentration Figure 6. Summed probability plots of minimum total near-surface history
between the top and bottom of the boulder can be resolved if, derived from 10Be. Red curves represent single 10Be measurements with
~200,000 years ago, it flipped after initial exposure and was 2σ internal error; the black line represents the sum of all samples. (A) All
then deposited on top of the clasts now underlying it (Fig. 2 and Hickory Run samples. (B) Quartzite bedrock outcrops. (C) Sandstone out-
Tables DR3–DR5 [see footnote 1]). High nuclide concentrations crops. (D) Other boulder field samples (Barrows et al., 2004; Goodfellow et
in clasts under the boulder provide further evidence for boulder al., 2014; Seong and Kim, 2003; Wilson et al., 2008). (E) Stable δ18O ratios
movement. Nuclide concentrations in clasts HR10 C1, C2, and in deep sea foraminifera (Railsback et al., 2015). Even numbers represent
C3 are comparable to those of nearby surface boulders, and their cold glacial stages; odd numbers are interglacials. LGM—Last Glacial
26Al/10Be ratios are indistinguishable from the production ratio. Maximum.
This is likely because the clasts spent most of their history near
the surface and still receive substantial cosmic ray dosing up-field stripping of regolith and the boulders have remained in
through the overlying 48 cm of rock. place, then the speed represents the rate at which the bedrock/
regolith boundary moved upslope.
The positive linear relationship between 10Be concentration and
distance downfield allows calculations of the rate at which the At Hickory Run, minimum total near-surface histories are var-
field changes over time. Assuming boulders were sourced from ied and long. They range from 70 to 600 k.y. with a mode between
outcrops upslope of the field, the relationship between 10Be con- 120 and 210 ka. Such histories are similar to those reported in
centration and distance downslope can be interpreted as a rate of boulder field samples collected elsewhere (Wilson et al., 2008)
transport (Jungers et al., 2009; Nichols et al., 2005; West et al., (Fig. 6) and together suggest that boulder fields are persistent fea-
2013). Given a local 10Be production rate of 6 atoms g−1 y−1 and a tures that can survive multiple glacial cycles. Boulders at Hickory
regression slope of 4050 atoms m−1 (Fig. 3), the average rate of Run have much longer minimum total near-surface histories than
boulder movement is ~15 mm y−1 presuming the boulders remain sandstone outcrops in the central Appalachian Mountains, but
exposed at the surface, and slower if the boulders were buried or have minimum total near-surface histories only slightly greater
flipped during transport as suggested by 26Al/10Be ratios, dis- than quartzite outcrops in the region (Portenga et al., 2013), con-
cussed above. Alternatively, if the field is the result of progressive sistent with the indurated nature of rock exposed at Hickory Run
(Fig. 6). The similarity of near-surface residence time (Fig. 6)
between quartzite outcrops and Hickory Run boulders suggests a
different approach to interpreting boulder fields—considering
8 GSA Today | March-April 2018