
Page 43 - i1052-5173-29-1_GSAT
P. 43
Leventer, 1998). For this reason, the map
will help scientists better understand how
our oceans have responded and will
respond to environmental changes.
POTENTIAL AND
FUTURE PROSPECTS
Big Data and AI are having an impact
on every commercial and scientific
domain, and their application in the field
of geosciences is making a great impact
in the analysis and understanding of
natural phenomena.
The intensive use of CPUs required by
these two technologies has stimulated the
search for alternative solutions to improve
performance by using a mixed CPU-GPU
approach. In this way it is possible to obtain
rapid results from huge databases and the
acceleration of the learning process for
neural networks. These techniques are the
basis of deep learning, an alternative model
of machine learning, which achieves a very
high degree of accuracy in recognizing
objects and is able to learn features auto-
matically from data without the need to
extract them manually.
The joint application of Big Data–
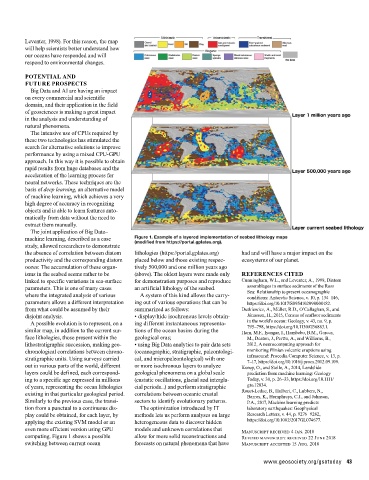
machine learning, described as a case Figure 1. Example of a layered implementation of seabed lithology maps
study, allowed researchers to demonstrate (modified from https://portal.gplates.org).
the absence of correlation between diatom lithologies (https://portal.gplates.org) had and will have a major impact on the
productivity and the corresponding diatom placed below and those existing respec- ecosystems of our planet.
oozes: The accumulation of these organ- tively 500,000 and one million years ago
isms in the seabed seems rather to be (above). The oldest layers were made only REFERENCES CITED
linked to specific variations in sea-surface for demonstration purposes and reproduce Cunningham, W.L., and Leventer, A., 1998, Diatom
parameters. This is one of many cases an artificial lithology of the seabed. assemblages in surface sediments of the Ross
where the integrated analysis of various A system of this kind allows the carry- Sea: Relationship to present oceanographic
conditions: Antarctic Science, v. 10, p. 134–146,
parameters allows a different interpretation ing out of various operations that can be https://doi.org/10.1017/S0954102098000182.
from what could be assumed by their summarized as follows: Dutkiewicz, A., Müller, R.D., O’Callaghan, S., and
disjoint analysis. • display/hide isochronous levels obtain- Jónasson, H., 2015, Census of seafloor sediments
A possible evolution is to represent, on a ing different instantaneous representa- in the world’s ocean: Geology, v. 43, no. 9, p.
795–798, https://doi.org/10.1130/G36883.1.
similar map, in addition to the current sur- tions of the ocean basins during the Ham, M.F., Iyengar, I., Hambebo, B.M., Garces,
face lithologies, those present within the geological eras; M., Deaton, J., Perttu, A., and Williams, B.,
lithostratigraphic succession, making geo- • using Big Data analytics to pair data sets 2012, A neurocomputing approach for
chronological correlations between chrono- (oceanographic, stratigraphic, paleontologi- monitoring Plinian volcanic eruptions using
stratigraphic units. Using surveys carried cal, and micropaleontological) with one infrasound: Procedia Computer Science, v. 13, p.
7–17, https://doi.org/10.1016/j.procs.2012.09.109.
out in various parts of the world, different or more isochronous layers to analyze Korup, O., and Stolle, A., 2014, Landslide
layers could be defined, each correspond- geological phenomena on a global scale prediction from machine learning: Geology
ing to a specific age expressed in millions (eustatic oscillations, glacial and intergla- Today, v. 30, p. 26–33, https://doi.org/10.1111/
of years, representing the ocean lithologies cial periods...) and perform stratigraphic gto.12034.
existing in that particular geological period. correlations between oceanic crustal Rouet-Leduc, B., Hulbert, C., Lubbers, N.,
Barros, K., Humphreys, C.J., and Johnson,
Similarly to the previous case, the transi- sectors to identify evolutionary patterns. P.A., 2017, Machine learning predicts
tion from a punctual to a continuous dis- The optimization introduced by IT laboratory earthquakes: Geophysical
play could be obtained, for each layer, by methods lets us perform analyses on large Research Letters, v. 44, p. 9276–9282,
applying the existing SVM model or an heterogeneous data to discover hidden https://doi.org/10.1002/2017GL074677.
even more efficient version using GPU models and unknown correlations that Manuscript received 4 Jan. 2018
computing. Figure 1 shows a possible allow for more solid reconstructions and Revised manuscript received 22 June 2018
switching between current ocean forecasts on natural phenomena that have Manuscript accepted 15 Aug. 2018
www.geosociety.org/gsatoday 43