
Page 7 - gt1503-04
P. 7
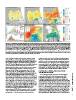
Figure 2. (A–C) Differential LiDAR models illustrating total vertical ground movements (∆ETot) in Christchurch through the Canterbury Earthquake Sequence (CES).
(A) Vertical movement from the initial 4 Sept. 2010 event. (B) Further vertical movement resulting from the 22 Feb. 2011 event. (C) Total vertical movements through
the entire CES. Also shown are location of Avon River (AR) and Heathcote River (HR) mouths, the Avon-Heathcote Estuary (AHE), the Central Business District
(CBD), the 6.5-ka maximum inland extent of postglacial marine transgression (blue dashed line) after Brown and Weeber (1992), and blind fault locations (black
dashed lines) for 22 Feb. 2011 (i), 13 June 2011 (ii), and 23 Dec. 2011 (iii). Linear artefacts evident in (A)–(C) are due to minor elevation errors along LiDAR flight lines.
(D) Histograms of LiDAR vertical ∆ELiq) and horizontal (∆XLiq) displacements classified according to observed land damage classes: ∆ELiq was calculated by subtracting
tectonic vertical movements (Beavan et al., 2012b) from ∆ETot. (E) Cumulative tectonic vertical movements (∆ETec) through the CES, with blind fault locations shown.
(F) Cumulative vertical movements through the CES for the AHE (∆ETot), with blind fault locations shown. Note that linear artefacts in (F) are due to minor elevation
errors due to interpolation between ground survey and depth-sounder survey transects.

vertical and horizontal ground movements evident in LiDAR-             combined tectonic down-throw and liquefaction/lateral spread                                             GSA TODAY | www.geosociety.org/gsatoday/
derived DEMs correlated strongly with detailed ground-based            (Fig. 2F). In other areas, Avon-Heathcote Estuary subsidence of
land damage observations conducted by Tonkin & Taylor Ltd. for         more than 1 m reflects natural widening or deepening of estuarine
New Zealand Earthquake Commission insurance assessments                tidal channels since pre-CES surveys, and comparable upward
(Fig. 2D). Horizontal ground movements were recorded across the        movements reflect channel infilling. Using a calibrated hydrody-
city, and areas adjacent to the Avon River experienced severe          namic model (Measures and Bind, 2013), neap and spring tidal
lateral spread, particularly on current and former inner meander       prism volumes are calculated to have reduced by 17.6% and 12.4%,
bends and tidal wetland sediments, in places exceeding 2 m             respectively, with an average tidal prism reduction of 14.6%.
(Beavan et al., 2012a) (Fig. 3). A comparison of pre-CES and
post–13 June 2011 river and floodplain cross sections, derived         EARTHQUAKES, FLOODING, AND SEA-LEVEL RISE:
from a combination of direct river bed depth measurements and          THE PRESENT AND FUTURE
LiDAR data, shows floodplain subsidence and river channel
narrowing and shallowing (Fig. 3, inset panels i–v) resulting from       Prior to the CES, flooding was perceived as Christchurch’s
lateral spread and sedimentation from liquefaction ejecta entering     primary hazard (Center for Advanced Engineering, 1995).
waterways. Smaller cross-sectional channel areas and lower flood       Contributors included urban rivers and streams, localized
plains collectively reduced channel cross-sectional areas and          ponding of overland flow on the developed coastal plain, and
increased flood hazard. The upper reaches of the Heathcote River       drainage-induced ground settlement. In 2010 to 2011, seismically
are located in an area of net tectonic subsidence through the CES,     induced landscape changes significantly increased the city’s flood
and its lower reaches are in an area of uplift (Fig. 2E) that reduced  risk. Key factors in this increase were the widespread tectonic and
river gradients. Differential elevation analysis for the Avon-         liquefaction-induced subsidence and alteration of the longitudinal
Heathcote Estuary (Fig. 2F) shows that 76% of its area was             and cross-sectional profiles and sediment regimes of urban water-
uplifted during the CES, 60% of the area is in the 0–0.4 m uplift      ways. Lowering of surface elevations relative to water tables (van
range corresponding to the cumulative CES tectonic signature,          Ballegooy et al., 2014a) is likely to have increased the liquefaction
and subsidence >1 m at the Avon River mouth results from               and flood hazard. With groundwater levels (i.e., fully saturated
                                                                       soils) now closer to the ground surface, there is less soil above the

                                                                                                                                                                                7