
Page 8 - gt1503-04
P. 8
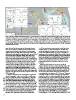
Figure 3. Main map: Cumulative horizontal movements (∆XLiq) in Christchurch in the vicinity of the Avon River from Sept. 2010 to 13 June 2011, derived from
                              LiDAR offset analysis (Beavan et al., 2012a). Also shown: Increased 1-in-100-year storm event (1% Annual Exceedence Probability [AEP]) flood depths (∆F) due
                              to subsidence caused by the Canterbury Earthquake Sequence using current sea level, rainfall, and urban extent. The Christchurch Central Business District
                              (CBD) is shown, as is the Dudley Creek/Flockton area where recent flooding of residential properties has been problematic. Inset panels: Floodplain and river
                              cross sections (i–v) obtained from field survey and LiDAR analyses, with elevation (E) changes shown as relative level in meters (m RL) from 2008 (solid gray
                              lines) to Sept. 2011 (black lines). Transect distance (D) is in meters (m). The locations of stopbanks (SB) constructed after the 22 Feb. 2011 Christchurch
                              earthquake are shown in green.

GSA TODAY | MARCH/APRIL 2015  water table and therefore less capacity to absorb water during        1-in-100-yr event based on current sea level, rainfall, and urban
                              storm events. Leakage of underlying artesian aquifers through         development (Fig. 3). These flood depths were modeled using
                              breached aquitards may also have influenced local hydrologic          independent hydraulic modeling for watercourses and rain-on-
                              conditions (Cox et al., 2012) and thus impacted on surface water      grid for overland flows based on pre- and post-CES DEMs; our
                              infiltration. Another significant contributor to the increased flood  ongoing research is assessing the ability of these models to quanti-
                              hazard is widespread earthquake damage of the urban storm             tatively hindcast the March 2014 flooding. The documentation of
                              water network, much of which is yet to be repaired, including         large, loss-inducing flood events following the CES has prompted
                              open channels and underground pipes that were compromised by          an urgent and intent governmental focus on appropriate infra-
                              breakages, liquefaction blockages, and gradient changes. The post-    structure and urban planning responses; at present, the city’s
                              earthquake flood-scape may also have been influenced by New           post-quake flood-scape is cited as the primary concern of city
                              Zealand statutory resource management framework changes,              authorities.
                              instituted in the early 1990s, which were locally translated into a
                              new approach of naturalizing urban waterways and reducing               Relative sea-level rise of 0.5 to 1 m occurred in suburbs
                              engineered river widening and dredging programs. Pre-1990s            adjoining the lower Avon River and Avon-Heathcote Estuary that
                              development of the urban floodplains that are now experiencing        experienced tectonic down-throw and significant liquefaction/
                              enhanced flood hazards was facilitated by the earlier engineering     lateral spread subsidence through the CES. These areas have thus
                              approach to the urban rivers (Canterbury Regional Council, 1993,      experienced the equivalent of several centuries of projected rela-
                              1997; Wilson, 1989).                                                  tive sea-level rise in the absence of land elevation changes at the
                                                                                                    current global rate of sea-level rise of 3.3 ± 0.4 mm yr−1 (Cazenave
                                In 2013, the Christchurch City Council released revised flood       et al., 2014) and thus provide useful analogues for the potential
                              extents for projected 1-in-50-yr and 1-in-200-yr rainfall events      impacts of sea-level rise in other settings globally. In this instance,
                              using post-earthquake LiDAR-derived DEMs (CCC, 2014). The             gravel stop-banks were constructed along much of the Avon River
                              city subsequently experienced several intensive rainstorms in         in 2011 to temporarily mitigate the post-earthquake flood hazard
                              March 2014, resulting in widespread flooding of properties in         (Fig. 3, inset panels i–v). More thorough measures are required,
                              river suburbs that in some instances exceeded historical flooding     including locally tailored cost-benefit analyses of climate adapta-
                              depths and spatial extents due to floodplain subsidence through       tion options (e.g. Aerts et al., 2014) and investigative analysis of
                              the CES. Although the 1-in-50-yr models were good predictors of       urban wetlands e,cosystems (Kirwan and Megonigal, 2013) and
                              flooding at higher elevations, they over-predicted coastal flooding   their potential role in soft-engineering flood mitigation
                              because they incorporated a future 0.5 m increase in relative sea     (Temmerman et al., 2013). Probabilistic approaches that consider
                              level, a 16% increase in annual rainfall, and maximum probable        future impacts from natural phenomena, including tropical and
                              urban development impacts on storm water runoff. Here we              extra-tropical cyclones (Woodruff et al., 2013), earthquakes
                              present the latest assessments of increased flood depths for a        (Gerstenberger et al., 2014), and liquefaction (Quigley et al., 2013),

8