
Page 8 - gt1508
P. 8
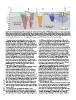
Figure 5. (A) Cross section showing the Pleistocene deposits that underlie the Blackwater National Wildlife Refuge. All ages are in thousands of years (ka).
Italicized ages are cosmogenic burial isochrons; underlined ages are radiocarbon ages; all others are optically stimulated luminescence ages. Yellow shading
represents Holocene deposits; green shading represents MIS 5 and MIS 3 deposits; shades of red, orange, and blue indicate three distinct paleochannel systems,
with depths of western channels inferred from boreholes drilled off the line of section; gray substrate is the Miocene Chesapeake Group. Note break in vertical
scale. See Fig. 4B for B–B´ line of section. See GSA Supplemental Data Figures S4 and S5 (see footnote 1) for more detail on sedimentology.
Temperatures and sea levels plunged prior to ca. 30 ka, from al., 2009), potentially due to local groundwater withdrawal for
their already low MIS 3 levels (Lambeck et al., 2014) (Fig. 2). As commercial use (Eggleston and Pope, 2013), the central Delmarva
the LIS grew, so did the forebulge that uplifted the Chesapeake Peninsula has the highest rates of subsidence in the mid-Atlantic
Bay region through the LGM, likely contributing to rapid incision region (~1.3–1.7 mm/yr; Engelhart et al., 2009). Parsing
documented along the Susquehanna and Potomac Rivers (Reusser GIA-driven subsidence from other RSL drivers is uncertain (e.g.,
et al., 2004) as the Chesapeake Bay region was transformed into a Cronin, 2012), but the agreement of twentieth-century subsidence
periglacial landscape. During the Holocene, the forebulge values calculated from tide gauge records where effects of seasonal
progressively subsided, as indicated by differential timing of and decadal variability are removed (~1.6 mm/yr, Boon et al.,
Holocene inundation and variable rates of sea-level rise along the 2010) and from dated Holocene deposits (~1.3 mm/yr; Engelhart
U.S. Atlantic Coast (Engelhart et al., 2009). The Blackwater River et al., 2009) from the same location near our study area implies
valley was inundated by ca. 5 ka, initiating deposition of bay consistency of rates over millennial timescales. Subsidence is thus
bottom silt. Widespread marshes were established sometime primarily driven by GIA in the Chesapeake Bay region, which
within the last millennium and accreted, keeping pace with makes RSL rise in the Chesapeake Bay–Washington D.C. area
sea-level rise. RSL rise accelerated along the U.S. Atlantic coast twice the twentieth-century global average rate of sea-level rise
during the twentieth century (Engelhart et al., 2009), resulting in (1.7 mm/yr; IPCC, 2013). If timescales of MIS 6 forebulge subsi
inundation, erosion, and ponding in the Blackwater National dence are used for comparison, subsidence from the LGM foreb-
Wildlife Refuge as sea-level rise outpaced marsh accretionary ulge collapse will continue for many more millennia.
processes (Fig. 3) (Stevenson et al., 2002). Ongoing GIA-driven subsidence in the Chesapeake Bay region
The presence of MIS 3 estuarine deposits near today’s sea level challenges a region already threatened by sea-level rise. At the
confirms the effects of GIA over long timescales for the Blackwater National Wildlife Refuge, we use rate consistency to
Blackwater National Wildlife Refuge and supports similar inter- predict ~0.16 m of subsidence for the region in the twenty-first
pretations within the greater Chesapeake Bay region. The eleva- century (using twentieth-century values from Boon and others
tions of MIS 3 estuarine deposits generally decrease from the [2010] that presumably include the effects of groundwater with-
Central Delmarva Peninsula southward to North Carolina (Scott drawal). The likely range of average global sea-level rise for the
et al., 2010); dated, emerged MIS 3 estuarine deposits are not twenty-first century is 0.33–0.82 m, based on a non-aggressive
found south of North Carolina. While the maximum elevations of climate mitigation policy (IPCC, 2013). Superimposing this sea-
MIS 3 deposits vary (GSA Supplemental Data Fig. S8 [see footnote level rise estimate over 0.16 m of subsidence yields a total
GSA TODAY | AUGUST 2015 1]), decreasing elevations to the south are consistent with the predicted RSL rise of 0.49–0.98 m for the Blackwater National
shape of the forebulge based on subsidence rates (Engelhart et al., Wildlife Refuge by AD 2100.
2009). High-precision GPS data, though limited to a short time These are minimum estimates; several lines of evidence suggest
series, also indicate the highest rates of subsidence on the Atlantic that sea levels will rise more quickly in the Chesapeake Bay region.
coast are centered on the Chesapeake Bay region (Sella et al., 2007; Recent tide gauge analyses indicate the acceleration of sea-level
Snay et al., 2007). rise in the North Atlantic in recent decades, possibly due to
Our data support the hypothesis that subsidence in the dynamic ocean circulation processes (Yin et al., 2010; Boon, 2012;
Chesapeake Bay region is caused by the continued collapse of the Ezer and Corlett, 2012; Sallenger et al., 2012). If this acceleration
MIS 2 forebulge (Potter and Lambeck, 2003). While subsidence continues, it could induce an additional rise of 15 cm for the
rates vary within the Chesapeake Bay region (Fig. 1) (Engelhart et Chesapeake Bay and Washington D.C. areas by AD 2100 (Yin et
8