
Page 7 - i1052-5173-26-9
P. 7
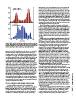
600 Pilbara-Yilgarn                                                          higher before 3.0 Ga than subsequently. The rates of continental
            (8,200 analyses)                                                 growth reflect the balance between the rates of generation and
                                                                             destruction of continental crust, and the change at ca. 3.0 Ga has
400                                                                          been taken to indicate that the dominant processes of crust gener-
                                                                             ation changed at about that time (Dhuime et al., 2012). There is a
200                                                                          broad consensus about the composition of the bulk/average conti-
                                                                             nental crust as presently preserved (Rudnick and Gao, 2003) and
  0                                                                          how that is different for Archean terrains (e.g., Fig. 3; Taylor and
300 Andes                                                                    McLennan, 1985). The challenge has been to obtain information
                                                                             on the composition of new continental crust, and whether that has
          (4,800 analyses)                                                   changed with time, because that constrains the conditions under
200                                                                          which the continental crust was generated.

100                                                                            Much of the geological record is of magmatic rocks derived
                                                                             from preexisting crustal rocks, but Sr, Nd, and Hf isotope data can
0      50 60 70               80                                             be used to estimate the Rb/Sr ratios of those crustal source rocks,
   40            SiO2 (%)                                                    which we take to represent new continental crust. Crustal differ-
                                                                             entiation processes produce a range of fractionated Rb/Sr ratios,
Figure 3. Whole rock SiO2 distributions of plutonic and volcanic rocks from  and there is therefore a strong positive correlation between Rb/Sr
Archean Pilbara-Yilgarn and the Andes. Data sources from the Western         and the SiO2 contents of crustal rocks and, in recent geological
Australia Geological Survey (http://geochem.dmp.wa.gov.au/geochem/) and      settings, with the thickness of the continental crust (Dhuime et
GEOROC (http://georoc.mpch-mainz.gwdg.de/georoc/), respectively.             al., 2015).

preserved, there is little evidence that the ages are concentrated in          Dhuime et al. (2015) combined crystallization ages, Nd model         GSA TODAY | www.geosociety.org/gsatoday
particular areas that might reflect plume activity. There is, for            ages, and initial Sr isotope ratios of igneous rocks to calculate the
example, a peak of zircon crystallization ages associated with the           Rb/Sr ratios of their crustal source rocks in the period between
Grenville at ca. 1 Ga (Fig. 1), and the Grenville is widely regarded         the model ages, taken to reflect the time those crustal source rocks
as a collisional event (Gower and Krogh, 2002), rather than a time           were derived from the mantle, and the time of generation and
of unusual volumes of magma generation. We conclude that the                 crystallization of the magmatic rocks analyzed. These time-
tectonic settings in which magmas are generated, and the colli-              integrated Rb/Sr ratios are thought to reflect those of new conti-
sional regimes associated with the supercontinent cycle, have                nental crust, because they are calculated from the time of their
shaped aspects of the preserved geological record. Not all collision         model Nd ages. The Rb/Sr ratios of new continental crust are
orogenies are marked by peaks in the ages of zircons; for example,           highly scattered prior to 3.0 Ga, but the median is ~0.03, and it
most of the detrital zircons in rivers draining the Appalachian              increased to a maximum value of ~0.08 from 3.0 to 1.7 Ga, before
Mountains have ages associated with the Grenville rather than the            decreasing to values of ~0.065 in the past ~1 b.y. (Fig. 4A). The
Paleozoic (Eriksson et al., 2003). The implication is the numbers            implication is that the SiO2 contents of new crust increased from
of zircons of different ages preserved in sediments depend on the            ~48% before 3.0 Ga to more intermediate compositions, with SiO2
depths of erosion of likely source areas, and hence presumably on            up to ~57%. This is attributed to a shift from broad-scale mantle
the amounts of crustal thickening. Alternatively, although colli-            melting and diffuse magma injection prior to 3.0 Ga to a subse-
sion related magmas contain greater numbers of zircons than                  quent plate tectonic regime involving subduction-related magma-
convergent plate margin magmas, the volume of such magmas is                 tism at plate boundaries (e.g., Sizova et al., 2010).
so small that this cannot explain the co-incidence of the peaks of
zircon ages with the times of supercontinent assembly (Cawood et               The Rb/Sr ratios of igneous rocks in modern-day Central and
al., 2013; Hawkesworth et al., 2013).                                        South America increase with crustal thickness, and so the
                                                                             temporal increase in the Rb/Sr ratio of new continental crust may
CRUSTAL THICKNESS (AND VOLUME) THROUGH TIME                                  also indicate that the thickness of the crust at the sites of crust
                                                                             generation increased from 20 km at 3.0 Ga to almost 40 km at ca.
  A number of different approaches have concluded that                       1.7 Ga. The estimated thickness then decreased to nearer 30 km
65%–70% of the present volume of the continental crust had been              since ca. 1 Ga (Dhuime et al., 2015). The predominantly mafic
formed by the late Archean (3.0–2.5 Ga; Belousova et al., 2010;              character of Earth’s crust before 3.0 Ga (see also Kemp et al., 2010;
Campbell, 2003; Dhuime et al., 2012; Kramers, 2002). It follows              Tang et al., 2016) means that it would have had a higher density
that the rates of continental growth (i.e., the rates of increase in         and been less buoyant than modern continental crust, resulting in
the volume of continental crust with time) were significantly                a greater probability for its recycling into the mantle. Recent
                                                                             geodynamic modeling of Archean crust generated under higher
                                                                             mantle temperatures suggests that it would have been gravitation-
                                                                             ally unstable and susceptible to recycling through delamination
                                                                             (Johnson et al., 2013).

                                                                               The curves for crustal growth rates from Belousova et al. (2010)
                                                                             and Dhuime et al. (2012) are based on the proportion of juvenile
                                                                             to reworked crust at different times. Such cumulative growth
                                                                             curves cannot decrease with time (Fig. 4B), and so the curve of
                                                                             changing crustal thickness through time offers a different

                                                                                                                                                    7