
Page 22 - i1052-5173-27-2
P. 22
n = 11,438
Altai
Tian Shan
Tibetan Plateau
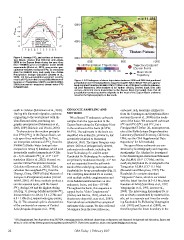
Figure 3. Average δ18Op and surface air tempera-
ture (black, dashed line) (Mitchell and Jones,
2005) in the Zaysan Basin during the year. Gray
lines—SWING2 general circulation model (GCM) Trajectory Endpoint
experiments (Risi et al., 2012); gray points—pre- % of Precipitation Trajectories (Zaysan Basin)
cipitation-weighted seasonal δg1r8eOepnalsinees—tiOmnaltiende
from the SWING2 data; dark 2.5 5 10 15 20 30 40 50 70 100 Mean Storm
Trajectory
Precipitation Isotope Calculator (Bowen et al.,
2005); red line—precipitation-weighted monthly
means of iδn18POrpefcroipmitathtieonUr(uGmNIqPi )Gsloiteba(IlANEeAtw/WorMk Oof,
Isotopes Figure 4. 2-D histogram of storm trajectories between 2005 and 2015 that produced
2016); blue points—measured stream water δ18O precipitation over the Zaysan Basin, mapped using the Hybrid Single-Particle Lagrang-
in Kazakhstan. ian Integrated Trajectory Model (HYSPLIT) (Stein et al., 2015) (see the GSA Supplemen-
tal Data Repository [text footnote 1] for further details). Dashed black lines with
arrows—dominant storm trajectories to the Zaysan Basin (red point). Note that all
precipitation-producing storms originate to the west of the Zaysan Basin and none
traverse the high topography to the south.
south in October (Schiemann et al., 2009). GEOLOGIC SAMPLING AND carbonate-rich, lacustrine Akzhar Sv.
During this biannual migration, cyclones METHODS from the Tayzhugen and Kyzylkain River
originating to the west interact with the sections (Lucas et al., 2009) in the south-
Tian Shan and Altai, producing oro- We collected 77 pedogenic carbonate west of the basin. We measured carbonate
graphic precipitation (Schiemann et al., samples from the type-section in the d18O and d13C (d18Oc and d13Cc) on a
2008, 2009; Baldwin and Vecchi, 2016). Zaysan Basin along the Kalmakpay River Finnigan MAT Delta+ XL mass spectrom-
in the southeast of the basin (47.4°N; eter at the Stable Isotope Biogeochemistry
To characterize the modern precipita- 84.4°E). The sediments in the basin are Laboratory (Stanford University, California,
tion d18O (d18Op) in the Zaysan Basin, we classified into svitas (Sv.; similar to, but USA; see the GSA Supplemental Data
rely upon three methods (Fig. 3). First, not strictly identical to formation) Repository1 for full methods).
we interpolate estimates of d18Op from the (Borisov, 1963). The upper Neogene com-
SWING2 (Stable Water Isotope Inter prises ~200 m of pedogenically altered, The ages of these sediments are con-
comparison Group 2) database, which uses carbonate-rich redbeds, including the strained by biostratigraphy and magneto-
isotopically enabled atmospheric GCMs lower Kalmakpay Sv. and the upper stratigraphy. The Akzhar Sv. is assigned
(n = 6) to estimate d18Op at ~2.5° × 2.5° Karabulak Sv. Kalmakpay Sv. sediments to the Shanwangian Asian Land Mammal
resolution (Risi et al., 2012). Second, we are primarily mudstones that dip ~15° NE Age (ALMA) (16.9–13.7 Ma), and the
use the Online Precipitation Isotope and are separated from the yellowish overlying Sarybulak Sv. is assigned to the
Calculator (Bowen et al., 2005). Third, we sands of the underlying, carbonate-poor Tunggurian ALMA (13.7–11.1 Ma)
calculate flux-weighted d18Op from the Sarybulak Sv. by an unconformity (Fig. 5). (Kowalski and Shevyreva, 1997). The
Urumqi, China, GNIP (Global Network of The overlying Karabulak Sv. is coarser, Karabulak Sv. contains abundant
Isotopes in Precipitation) station (IAEA/ with multiple pebble conglomerates and “Hipparion” fauna, which is correlated
WMO, 2016). All three methods produce a cross-bedded sandstones that cut into with the latest Turolian (8.7–5.3 Ma; latest
similar seasonal cycle, with the lowest pedogenic facies, and dips ~10° NE. Baodean ALMA) (Sotnikova et al., 1997;
d18Op during DJF and the highest during Throughout the basin, this sequence is Vangengeim et al., 1993; Lucas et al.,
JJA (Fig. 3). Average MAM and SON d18Op capped by the “Gobi Conglomerate” 2009). The intervening Kalmakpay Sv. is
is lower relative to JJA by 3.6 ± 2.3‰ and (Berkey and Morris, 1923), which is a not as clearly constrained by mammal fos-
6.8 ± 1.8‰ (1s), respectively (gray points, Quaternary deposit (Lucas et al., 2009), sils, yet is a separate unit from the overly-
Fig. 3). This seasonal cycle is characteristic from which we collected five samples of ing Karabulak Sv. Following Vangengeim
of the continental air masses of Central carbonate-rich cement. We also collected et al. (1993) and Lucas et al. (2009), we
Asia (Araguás-Araguás et al., 1998). 54 samples from the lower Miocene, therefore place the lower boundary in the
1 GSA Supplemental Data Repository Item 2017024, containing methods, additional climatology, sedimentary, and diagenetic background and discussion, figures and
tables, is online at http://www.geosociety.org/datarepository/2017/. If you have questions, please email gsatoday@geosociety.org.
22 GSA Today | February 2017