
Page 23 - i1052-5173-27-2
P. 23
320 Karabulak Fauna Eolian Accumulation
Rate (mg/cm2/kyr)
270 Karabulak Sv. 0 100cPleino-e Qu.Rain-shadow in western Mongolia
(Caves et al. 2014)
(upper Baodean ALMA) 0 Gobi Conglomerate Altai uplift
Karabulak Sv. North Tian Shan uplift
5
10 Kalmakpay Sv.
220
Height (m) Age (Ma)
Kalmakpay Sv. Miocene
15
(lower Baodean ALMA)
Akzhar Sv.
170 20 Sv. mean, 1 (x),
and age range (y)
Zaysan Basin
Junggar Basin
Issyk Kul
Ol.
All other Central
Sarybu-
lak Sv. 25 Asia data
120 16 18 20 22 24 26
14 16 18 20 22 −8 −6 −4 δ18Oc (VSMOW)
δ18O (‰ VSMOW) δ13C (‰ VPDB)
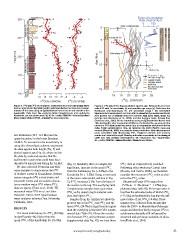
Figure 5. δ18O and δ13C of pedogenic carbonates from the Kalmakpay River Figure 6. δ18O data from Zaysan plotted against age. Red points are mean
section against stratigraphic height. Solid and dashed red lines are a kernel- svita δ18O with 1σ uncertainty (x) and possible age range (y). Data from the
smooth of the data using an Epanechnikov kernel (mean and 1σ) with a 6 m Karabulak and Kalmakpay Sv. are smoothed using 1 Ma bandwidth
bandwidth. Data from the overlying Gobi Conglomerate and underlying Epanechnikov kernel (solid red line) with 1σ uncertainty (dashed red lines).
Akzhar Sv. are not shown (see Fig. 6). Sv.—svita; VSMOW—Vienna Standard Also plotted are published data from Central Asia (gray lines), Issyk Kul
Mean Ocean Water; VPDB—Vienna Pee Dee belemnite. (orange line; Macaulay et al., 2016), and the Junggar Basin (brown line;
Charreau et al., 2012). All are smoothed using an Epanechnikov kernel with
late Sarmatian (12.7–11.6 Ma) and the 1 Ma bandwidth, after Caves et al. (2015). For the Akzhar Sv., we also plot the
upper boundary in the lower Baodean minimum δ18O value (small red point) due to evaporative enrichment in this
ALMA. To account for the uncertainty in svita. Eolian accumulation rate, as recorded by North Pacific deep-sea
records (Rea et al., 1998), is a proxy for loess production. Note the prominent
peak coincident with rdiegchrte. aSshiandginδg18iOndc.icRaetegsiounnacl ecrtliaminattyicinatnhde tectonic
events are listed to the timing of
uplift and rain shadow development. Ol.—Oligocene; Qu.—Quaternary;
Sv.—svita; VSMOW—Vienna Standard Mean Ocean Water.
using this chronologic scheme, we present
the data against both height (Fig. 5) and
plotted against age (Fig. 6), where we bin
the data by svita and assume that the
sediments in each svita could have been
deposited at any interval during the ALMA. (Fig. 5). Similarly, there is a slight, but d18Oc data as evaporatively enriched.
We also collected 29 stream and well- significant, increase in the mean d13Cc Following other studies in Central Asia
from the Kalmakpay Sv. (-5.8‰) to the (Rowley and Currie, 2006), we therefore
water samples to characterize the d18O Karabulak Sv. (-5.2‰). Using an estimate consider the minimum d18Oc value as clos-
of modern waters in Kazakhstan. Stream of the mean value (solid, red line in Fig. est to the d18Op value.
waters integrate d18O across storm and 5), d13Cc increases 2.5‰ from the base of
snowmelt events and are used to charac- the section to the top. The overlying Gobi Stream/well water d18O ranges from
terize modern water d18O where d18Op Conglomerate samples have equivalent -15.5‰ to -11.3‰ (mean = -13.7‰) (sup-
data are sparse (Hoke et al., 2014). We d18Oc as the underlying Karabulak sam- plemental data Table S2). This mean value is
measured water d18O on a Los Gatos ples, but higher d13Cc. less than the estimated value of MAM d18Op
Research TWIA-45EP liquid isotope (-12.3‰) and substantially less than the esti-
water analyzer at Santa Clara University, Samples from the Akzhar Sv. show the mated value of JJA d18Op (-8.6‰). These
California, USA. greatest spread in d13Cc and d18Oc and the samples were collected from streams that
mean d18Oc (24.7‰) is significantly higher drain the 2500+ m Manrak-Saur-Dzhungar
RESULTS than the overlying svitas (see GSA supple- ranges and therefore likely integrate d18O in
The mean Kalmakpay Sv. d18Oc (20.6‰) mental data Table S1). Given the correla- catchments potentially still influenced by
is significantly 4‰ higher than the tion between d18Oc and carbonate content snowmelt and with large variations in eleva-
mean d18Oc of the Karabulak Sv. (16.8‰) (supplemental data Fig. S2), we treat these tion (Hoke et al., 2014).
www.geosociety.org/gsatoday 23