
Page 28 - i1052-5173-28-8
P. 28
Rapid 3-D analysis of rockfalls
Greg M. Stock, National Park Service, Yosemite National Park, El Portal, California 95318, USA; Antoine Guerin, Risk Analysis
Group, Institute of Earth Sciences, University of Lausanne, Lausanne, Switzerland; Nikita Avdievitch, National Park Service,
Yosemite National Park, El Portal, California 95318, USA; Brian D. Collins, U.S. Geological Survey, Menlo Park, California 94025,
USA; Michel Jaboyedoff, Risk Analysis Group, Institute of Earth Sciences, University of Lausanne, Lausanne, Switzerland.
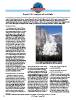
INTRODUCTION Figure 1. A 9,811 m3 rockfall from the southeast face of El Capi-
tan at 14:21 PST on 28 Sept. 2017. Photo by Przemek Pawilkowski.
On the afternoon of 27 Sept. 2017, thou-
sands of visitors to Yosemite National Park decade collecting baseline remote sensing rapidly analyzing the rockfalls that
were enjoying scenic attractions in Yosemite data of the cliffs, including gigapixel imag- occurred in Sept. 2017.
Valley. Dozens of rock climbers were scal- ery, infrared thermal imagery, and high-
ing El Capitan, a 900-m-tall granitic cliff resolution terrestrial laser scanning (TLS) RAPID ANALYSIS OF THE EL
famous for its challenging climbing routes. data. These data allow us to track rockfall CAPITAN ROCKFALLS
Suddenly, at 13:51 Pacific Standard Time activity, quantitatively document events, and
(PST), a rock slab detached from 230 m up evaluate rockfall susceptibility (e.g., Stock et Within three hours of the initial rockfall
the southeast face of El Capitan. Tragically, al., 2017; Matasci et al., 2018). El Capitan has on 27 Sept., we acquired photographs of the
rock debris struck two rock climbers walk- been a particular focus, with five TLS acqui- cliff from a helicopter. We built a SfM point-
ing along the base of the cliff, killing one sitions since Oct. 2010. We also generated a cloud model from these photographs,
and seriously injuring the other. Over the “historical” 3D model using Structure-from- aligned it with earlier TLS data, and per-
next three hours, as the park’s search and Motion (SfM) photogrammetry techniques formed a point-to-mesh comparison (e.g.,
rescue team worked to extract the climbers, (Westoby et al., 2012; Guerin et al., 2017); Guerin et al., 2017). The resulting difference
six more rockfalls originating from the new derived from black-and-white photographs map yields precise locations, dimensions,
scar pummeled the base of the cliff. The taken from a helicopter ca. 1976, this SfM and volumes for the rockfalls (Fig. 2). The
following afternoon at 14:21 PST, a much model shows El Capitan as it looked more cumulative volume of all rockfalls on 27
larger rockfall occurred from the same loca- than 40 years ago (Stock et al., 2017). All Sept. was 453.3 ± 42.3 m3, with the first
tion. A massive slab fell from just above the of these baseline data proved critical for event being the largest at 290.0 ± 27.8 m3.
previous day’s rockfalls, fragmenting on We repeated this process the following day
impact and generating an enormous dust
cloud (Fig. 1). A rock fragment struck a
vehicle, puncturing the sunroof and injuring
the driver, prompting temporary closure of
the main road exiting Yosemite Valley. To
manage these challenging events, the
National Park Service (NPS) had a critical,
immediate need for quantitative information
regarding the sequence of events and the
potential for additional rockfalls.
BASELINE DATA COLLECTION
Rockfalls are common in Yosemite
Valley, with up to 80 events documented
each year (Stock et al., 2013). Rockfalls are
the dominant erosional process in Yosemite,
key to shaping this iconic landscape but
also, with 4–5 million visitors to the park
each year, posing significant risk (Stock
and Collins, 2014). With more than 50
km2 of rockfall-prone cliffs in Yosemite
Valley alone, it is difficult to anticipate
when and where the next rockfall will
occur. Accordingly, we have spent the past
GSA Today, v. 28, https://doi.org/10.1130/GSATG374GW.1. Copyright 2018, The Geological Society of America. CC-BY-NC.
28 GSA Today | August 2018