
Page 6 - i1052-5173-27-9
P. 6
x x
y
y
A. Pixel smear Stream channel
appears to be on B.
Distortion of complex DEM resolution x
C.
y
z
z
E.
F.
D.
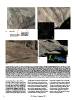
Figure 2. Virtual scenes of the case study area in Surprise Canyon, California, USA (near 36.1133N, 117.1617W), illustrating errors introduced in conven-
tional 2.5D methods (left, perspective views in Google Earth [A] and ArcGIS Pro [D]) versus approximately equivalent perspective views of georefer-
enced SfM point clouds obtained from oblique, ground-based photography (right). Insets (C) and (F) show local geologic interpretations with (E) and
(F) described further in Figure 4. Several errors are apparent in the left scenes. In (A) and (B) (yellow [x] and [y] are equivalent points on the images and
[C]) note the distortions and pixel smear in (A) versus true renderings in (B). (C) is a cyan-magenta stereo rendering of the lithologic contact between
the dark and light units between (x) and (y) as well as two faults (white lines, rendered blue and red in the view, are from the SfM model and yellow,
rendered green and red in the view); note how the 3D model allows 3D rendering of exposed fault faces as a jagged line versus the poor rendering of the
faults from map drapes as well as superior 3D resolution of the contact in the SfM model. In scenes (D) and (E) note how errors in the 2.5D method
introduce an artifact in D, labeled z, that could produce a major error in a geologic interpretation. In the left scene (D) rock units (outlined in black)
clearly appear to dip to the right in this rendering and a three-point analysis of the scene would confirm this, yet the true dip is to the left, which is clear
in the right scene (E) and in the field. (F) shows a visualization of structures present in the scene with the dark blue surface, indicating the folded axial
surface of early isoclinal folds and the vertical orange plane showing the axial surface of a second generation antiform that warps the older fold system.
visualizations (Figs. 1 and 2 and Data a photorealistic 3D model of Earth’s surface eliminated. In addition, there is no doubt
Repository supplement 1 [see footnote 1]). (Fig. 3). Best practices still need further in this method that every point in the point
The colored terrain model is still subject to research, but we have found that direct map- cloud has a proper color for its position in
look angle issues such that a model gener- ping on the colored point cloud is straight- 3D space because the point color is derived
ated entirely by surface observations will forward in several software packages (e.g., directly from the photographs that gener-
be limited by the available views (Fig. 3). see workflow suggestions at www.geo ated the model. In the following section,
Nonetheless, it is straightforward with this .utep.edu/pavlis/digitalmappingwebpages/). we illustrate the power of using these
technology to combine ground-based pho- In this approach, problems like pixel smear models to solve a field problem, but appli-
tographs and aerial photographs, producing and distortions from image drape are cations are nearly limitless.
6 GSA Today | September 2017