
Page 6 - i1052-5173-29-7-small
P. 6
al., 2014; Eddy et al., 2014; Van Avendonk
et al., 2015), were digitized and added to
the comparison. With 11–12-km station
spacing and the incorporation of coinci-
dent seismic reflection data, crustal thick-
ness estimates from the GUMBO lines
have the highest resolution in this study.
DATA AND METHODS
Model comparisons with original figures
are complicated by the different choices
authors make with respect to presentation:
models because only a few P-wave velocity 2011; Sutra and Manatschal, 2012). To color scales and ranges, color palettes, and
models span the southern U.S. Table 1 evaluate crustal thickness variations perturbations with respect to a model aver-
presents pertinent details about models across the study region, four models were age or a global standard, etc. Here we plot
that include the crust: SR16, DNA13, considered: SLK15, SR16, PnUS2016, all models on the same scale, in terms of
PLH15, PM15, and SLK15. The latter four and LITHO1.0. PnUS2016 (Buehler and perturbations with respect to the average of
models were generated via an iterative, Shearer, 2017) uses Pn arrivals, which are all models, using a consistent color scale.
linearized inversion algorithm. The global P waves that refract just below the Moho Most models used in this study were
optimization technique used to generate and are the first arrivals at regional dis- downloaded from the IRIS Earth Model
SR16 makes it unique within our set of tances, to constrain crustal thickness. Collaboration (http://ds.iris.edu/ds/
models, allowing for more formal estimates PnUS2016 utilizes the seismic velocities products/emc); others were received via
of uncertainties. An extended review of from SR16 to map crustal thickness. private correspondence. Using MATLAB,
data types and methods used to generate LITHO1.0 (Pasyanos et al., 2014) is con- each velocity model was linearly interpo-
all eight models examined in this study is structed by perturbing an initial model lated onto a three-dimensional (3D) grid
presented in the GSA Data Repository ; parameterized vertically as a series of geo- with 0.2° × 0.2° uniform lateral spacing
1
for further details readers are referred to physically identified layers, that is, a com- and 0.5-km depth spacing. For the southern
the original publications. bination of the CRUST1.0 model (Laske U.S., the domain of interest was bounded
et al., 2012) and the LLNL-G3D model latitudinally between 26°–37° N and longi-
CRUSTAL THICKNESS MODELS (Simmons et al., 2012), to fit surface wave tudinally between 78°–102° W. Using the
Crustal thickness varies substantially dispersion maps over the 5–40 mHz fre- interpolated shear velocity models, the lat-
across passive margins, including the quency band. Additionally, Moho depths eral root-mean-square velocity, V rms, for
northern Gulf of Mexico, and hence serves from velocity models based on results each model was calculated and compiled to
as an important parameter in reconstruct- from the 2010 GUMBO experiments, create average one-dimensional (1D) veloc-
ing the tectonic evolution and pre-rift consisting of four long-offset seismic ity individual models, and an average 1D
geometry of such regions (Reston and refraction profiles in the northern Gulf of model for the study area (SUSavg; Fig. 2A).
Morgan, 2004; Huismans and Beaumont, Mexico (Fig. 1) (Eddy, 2014; Christeson et This procedure was repeated to create
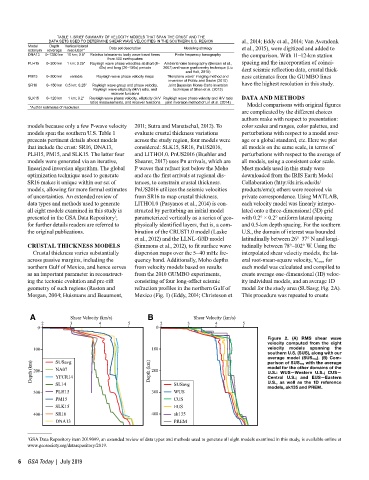
Figure 2. (A) RMS shear wave
velocity computed from the eight
velocity models spanning the
southern U.S. (SUS), along with our
average model (SUSavg). (B) Com-
parison of SUSavg with the average
model for the other domains of the
U.S.: WUS—Western U.S.; CUS—
Central U.S.; and EUS—Eastern
U.S., as well as the 1D reference
models, ak135 and PREM.
1 GSA Data Repository item 2019099, an extended review of data types and methods used to generate all eight models examined in this study, is available online at
www.geosociety.org/datarepository/2019.
6 GSA Today | July 2019