
Page 7 - i1052-5173-29-7-small
P. 7
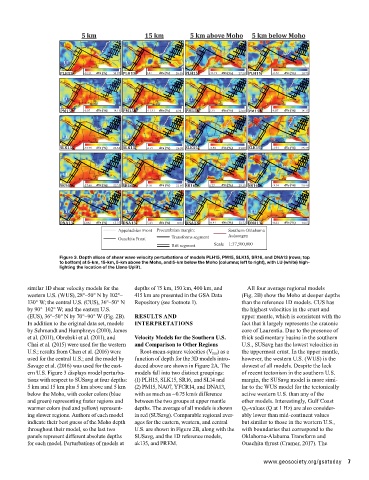
Figure 3. Depth slices of shear wave velocity perturbations of models PLH15, PM15, SLK15, SR16, and DNA13 (rows; top
                    to bottom) at 5-km, 15-km, 5-km above the Moho, and 5-km below the Moho (columns; left to right), with LU (white) high-
                    lighting the location of the Llano Uplift.


          similar 1D shear velocity models for the   depths of 75 km, 150 km, 400 km, and    All four average regional models
          western U.S. (WUS), 28°–50° N by 102°–  415 km are presented in the GSA Data   (Fig. 2B) show the Moho at deeper depths
          130° W; the central U.S. (CUS), 36°–50° N   Repository (see footnote 1).  than the reference 1D models. CUS has
          by 90°–102° W; and the eastern U.S.                                   the highest velocities in the crust and
          (EUS), 36°–50° N by 70°–90° W (Fig. 2B).   RESULTS AND                upper mantle, which is consistent with the
          In addition to the original data set, models   INTERPRETATIONS        fact that it largely represents the cratonic
          by Schmandt and Humphreys (2010), James                               core of Laurentia. Due to the presence of
          et al. (2011), Obrebski et al. (2011), and   Velocity Models for the Southern U.S.   thick sedimentary basins in the southern
          Chai et al. (2015) were used for the western   and Comparison to Other Regions  U.S., SUSavg has the lowest velocities in
          U.S.; results from Chen et al. (2016) were   Root-mean-square velocities (V rms) as a   the uppermost crust. In the upper mantle,
          used for the central U.S.; and the model by   function of depth for the 3D models intro-  however, the western U.S. (WUS) is the
          Savage et al. (2016) was used for the east-  duced above are shown in Figure 2A. The   slowest of all models. Despite the lack
          ern U.S. Figure 3 displays model perturba-  models fall into two distinct groupings:    of recent tectonism in the southern U.S.
          tions with respect to SUSavg at four depths:   (1) PLH15, SLK15, SR16, and SL14 and    margin, the SUSavg model is more simi-
          5 km and 15 km plus 5 km above and 5 km   (2) PM15, NA07, YFCR14, and DNA13,   lar to the WUS model for the tectonically
          below the Moho, with cooler colors (blue   with as much as ~0.75 km/s difference   active western U.S. than any of the
          and green) representing faster regions and   between the two groups at upper mantle   other models. Interestingly, Gulf Coast
          warmer colors (red and yellow) represent-  depths. The average of all models is shown   Q 0-values (Q at 1 Hz) are also consider-
          ing slower regions. Authors of each model   in red (SUSavg). Comparable regional aver-  ably lower than mid-continent values
          indicate their best guess of the Moho depth   ages for the eastern, western, and central   but similar to those in the western U.S.,
          throughout their model, so the last two    U.S. are shown in Figure 2B, along with the   with boundaries that correspond to the
          panels represent different absolute depths   SUSavg, and the 1D reference models,   Oklahoma-Alabama Transform and
          for each model. Perturbations of models at   ak135, and PREM.         Ouachita thrust (Cramer, 2017). The

                                                                                       www.geosociety.org/gsatoday  7