
Page 8 - i1052-5173-29-7-small
P. 8
SUSavg model is also distinctly slower models derives from the USArray’s into differences in anomaly amplitudes,
than the EUS model at all depths. Transportable Array (TA), which has a although patterns should be robust
nominal station spacing of ~70 km. The between techniques and parameterizations.
Geologic and Tectonic Patterns resulting relatively low horizontal resolu- PM15 shows the least change in anomaly
In the upper crust, large-scale patterns of tion of these models makes it difficult to pattern from 5 km depth to 5 km below the
anomalies are consistent between all the constrain effectively the exact geometry of Moho, reflecting its decreasing resolution
models, matching the geometry of major small-scale geologic features in this region. with depth. DNA13 has a relatively small
features in the region; i.e., the Ouachita Amplitudes of anomalies vary signifi- range of anomaly amplitudes at depths of
orogenic front and the Precambrian margin cantly between models (note the different 5 km and 15 km, with less consistent
(Fig. 3 with locations in Fig. 1). Areas to ranges in the color bars). There are at least anomaly patterns compared to the other
the north of the Precambrian margin, which two reasons to expect such variations. models (Fig. 2). This difference, with
comprise cratonic continental crust, are First, constraints imposed by data on respect to other models, is likely due to
faster at shallower depths than in the region model parameters usually range from the lack of surface wave data in DNA13.
enclosed between the Alabama-Oklahoma overdetermined to underdetermined in
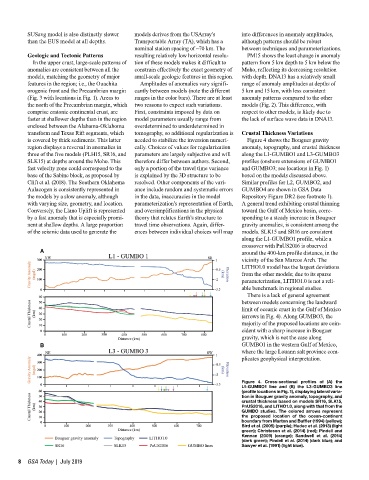
transform and Texas Rift segments, which tomography, so additional regularization is Crustal Thickness Variations
is covered by thick sediments. This latter needed to stabilize the inversion numeri- Figure 4 shows the Bouguer gravity
region displays a reversal in anomalies in cally. Choices of values for regularization anomaly, topography, and crustal thickness
three of the five models (PLH15, SR16, and parameters are largely subjective and will along the L1-GUMBO1 and L3-GUMBO3
SLK15) at depths around the Moho. This therefore differ between authors. Second, profiles (onshore extensions of GUMBO1
fast velocity zone could correspond to the only a portion of the travel time variance and GUMBO3; see locations in Fig. 1)
base of the Sabine block, as proposed by is explained by the 3D structure to be based on the models discussed above.
Clift et al. (2018). The Southern Oklahoma resolved. Other components of the vari- Similar profiles for L2, GUMBO2, and
Aulacogen is consistently represented in ance include random and systematic errors GUMBO4 are shown in GSA Data
the models by a slow anomaly, although in the data, inaccuracies in the model Repository Figure DR2 (see footnote 1).
with varying size, geometry, and location. parameterization’s representation of Earth, A general trend exhibiting crustal thinning
Conversely, the Llano Uplift is represented and oversimplifications in the physical toward the Gulf of Mexico basin, corre-
by a fast anomaly that is especially promi- theory that relates Earth’s structure to sponding to a steady increase in Bouguer
nent at shallow depths. A large proportion travel time observations. Again, differ- gravity anomalies, is consistent among the
of the seismic data used to generate the ences between individual choices will map models. SLK15 and SR16 are consistent
along the L1-GUMBO1 profile, while a
crossover with PnUS2016 is observed
around the 400-km profile distance, in the
vicinity of the San Marcos Arch. The
LITHO1.0 model has the largest deviations
from the other models; due to its sparse
parameterization, LITHO1.0 is not a reli-
able benchmark in regional studies.
There is a lack of general agreement
between models concerning the landward
limit of oceanic crust in the Gulf of Mexico
(arrows in Fig. 4). Along GUMBO3, the
majority of the proposed locations are coin-
cident with a sharp increase in Bouguer
gravity, which is not the case along
GUMBO1 in the western Gulf of Mexico,
where the large Louann salt province com-
plicates geophysical interpretation.
Figure 4. Cross-sectional profiles of (A) the
L1-GUMBO1 line and (B) the L3-GUMBO3 line
(profile locations in Fig. 1), displaying lateral varia-
tion in Bouguer gravity anomaly, topography, and
crustal thickness based on models SR16, SLK15,
PnUS2016, and LITHO1.0, along with that from the
GUMBO studies. The colored arrows represent
the proposed location of the ocean-continent
boundary from Marton and Buffler (1994) (yellow);
Bird et al. (2005) (purple); Hudec et al. (2013) (light
green); Christeson et al. (2014) (red); Pindell and
Kennan (2009) (orange); Sandwell et al. (2014)
(dark green); Pindell et al. (2014) (dark blue); and
Sawyer et al. (1991) (light blue).
8 GSA Today | July 2019