
Page 5 - i1052-5173-32-9
P. 5
equivalent model to recognize rock fea- A B R-G-B
e
tures, we first need to think about the prop- 0.16
erties of the images themselves and how
well they capture those features. A potential
advantage for automated classification of re ectance 0.12 Hematite VNIR spectrum
rock elements is that geological materials RGB spectral sampling UV ( uorescence)
are made up of minerals with distinctive 0.08 Sensor spectral range
reflectance (Bishop et al., 2019) and bire- Added color bands
fringence (Cesare et al., 2022) characteris-
tics. Capturing these spectral properties 400 800 1200 1600
with a camera sensitive to more color bands wavelength [nm]
than the human eye can heighten contrast C 150MP 10 cm
between features in images and reduce the RGB photography Our setup D
number of training examples needed for White Single, narrow achromatic
accurate classification models (Soomro et light band light sensor
al., 2017). Here, we introduce a multispec- LED re ected
tral camera optimized for petrographic Color light array
study, which can facilitate image analysis as lter
a laboratory method to complement other Multispectral
geochemical and geophysical measurements.
transmitted
light table
IMAGING SETUP
The imaging setup presented herein is a Optical sensor with crossed
modification of the grinding, imaging, and polarizers
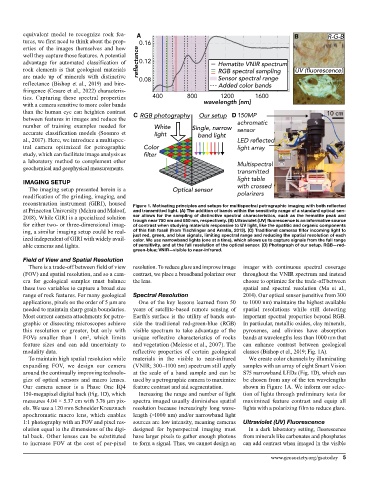
reconstruction instrument (GIRI), housed Figure 1. Motivating principles and setups for multispectral petrographic imaging with both reflected
at Princeton University (Mehra and Maloof, and transmitted light. (A) The addition of bands within the sensitivity range of a standard optical sen-
2018). While GIRI is a specialized solution sor allows for the sampling of distinctive spectral characteristics, such as the hematite peak and
trough near 750 nm and 850 nm, respectively. (B) Ultraviolet (UV) fluorescence is an informative source
for either two- or three-dimensional imag- of contrast when studying materials responsive to UV light, like the apatitic and organic components
ing, a similar imaging setup could be real- of this fish fossil (from Tischlinger and Arratia, 2013). (C) Traditional cameras filter incoming light to
ized independent of GIRI with widely avail- just red, green, and blue signals, limiting spectral range and reducing the spatial resolution of each
color. We use narrowband lights (one at a time), which allows us to capture signals from the full range
able cameras and lights. of sensitivity, and at the full resolution of the optical sensor. (D) Photograph of our setup. RGB—red-
green-blue; VNIR—visible to near-infrared.
Field of View and Spatial Resolution
There is a trade-off between field of view resolution. To reduce glare and improve image imager with continuous spectral coverage
(FOV) and spatial resolution, and so a cam- contrast, we place a broadband polarizer over throughout the VNIR spectrum and instead
era for geological samples must balance the lens. choose to optimize for the trade-off between
these two variables to capture a broad size spatial and spectral resolution (Ma et al.,
range of rock features. For many geological Spectral Resolution 2014). Our optical sensor (sensitive from 300
applications, pixels on the order of 5 µm are One of the key lessons learned from 50 to 1000 nm) maintains the highest available
needed to maintain sharp grain boundaries. years of satellite-based remote sensing of spatial resolutions while still detecting
Most current camera attachments for petro- Earth’s surface is the utility of bands out- important spectral properties beyond RGB.
graphic or dissecting microscopes achieve side the traditional red-green-blue (RGB) In particular, metallic oxides, clay minerals,
this resolution or greater, but only with visible spectrum to take advantage of the pyroxenes, and olivines have absorption
FOVs smaller than 1 cm , which limits unique reflective characteristics of rocks bands at wavelengths less than 1000 nm that
2
feature sizes and can add uncertainty to and vegetation (Melesse et al., 2007). The can enhance contrast between geological
modality data. reflective properties of certain geological classes (Bishop et al., 2019; Fig. 1A).
To maintain high spatial resolution while materials in the visible to near-infrared We create color channels by illuminating
expanding FOV, we design our camera (VNIR; 300–1100 nm) spectrum still apply samples with an array of eight Smart Vision
around the continually improving technolo- at the scale of a hand sample and can be S75 narrowband LEDs (Fig. 1D), which can
gies of optical sensors and macro lenses. used by a petrographic camera to maximize be chosen from any of the ten wavelengths
Our camera sensor is a Phase One IQ4 feature contrast and aid segmentation. shown in Figure 1A. We inform our selec-
150-megapixel digital back (Fig. 1D), which Increasing the range and number of light tion of lights through preliminary tests for
measures 4.04 × 5.37 cm with 3.76 µm pix- spectra imaged usually diminishes spatial maximized feature contrast and equip all
els. We use a 120 mm Schneider Kreuznach resolution because increasingly long wave- lights with a polarizing film to reduce glare.
apochromatic macro lens, which enables length (>1000 nm) and/or narrowband light
1:1 photography with an FOV and pixel res- sources are low intensity, meaning cameras Ultraviolet (UV) Fluorescence
olution equal to the dimensions of the digi- designed for hyperspectral imaging must In a dark laboratory setting, fluorescence
tal back. Other lenses can be substituted have larger pixels to gather enough photons from minerals like carbonates and phosphates
to increase FOV at the cost of per-pixel to form a signal. Thus, we cannot design an can add contrast when imaged in the visible
www.geosociety.org/gsatoday 5