
Page 7 - i1052-5173-32-9
P. 7
archaeocyathid boundstone sample, wherein Because these crystals are large relative to a pixel takes on a broader range of the color
each of the four classes (dolomite, micritic microscope FOV (Fig. 3A), the concentration and textural properties that a mineral may
calcite, archaeocyathid, and calcite-filled of minerals in an image will be variable exhibit in cross-polarized light, which helps
crack) shows well-correlated pixel values depending on the portion of the thin section the machine learning model generalize and
(Fig. 2B). When segmenting these samples, placed under the lens. For example, the con- leads to more accurate classifications with
the class overlap in RGB space hinders pixel- centration of plagioclase assessed through the same number of training samples (Figs.
wise classification, leading to uncertain classification may range from 29% to 55% 3C, 3D, and 3G).
boundaries between classes (Figs. 2D and when using the 2.5× objective on a petro-
2E). The same image in a UV-yellow-red col- graphic microscope (Fig. 3H). The variation DISCUSSION
orspace (Fig. 2A) shows reduced channel in concentrations increases if magnification Because our camera improves outcomes
covariance for all four classes (Fig. 2C). increases (reducing FOV) or point counts are when using machine learning techniques to
With the new spectral information available used to assess modality as opposed to pixel produce petrographic data, we now are
in UV-yellow-red space, an SVM has 30% classifications (Fig. 3H). focused on high-throughput methods for
improved accuracy, and produces resolved This example also illustrates the benefit complete sample image analyses within
regions with distinct boundaries for each of building additional image channels from stratigraphic sections or geologic maps. Our
class (Figs. 2D and 2F). polarizer orientations (as opposed to addi- workflow takes the same samples gathered
tional wavelengths of light). With a single for geochemical or geophysical laboratory
Case Study 2: Feature Mapping in RGB image from one orientation of the analyses and photographs them as pol-
Transmitted Light crossed polarizers, capturing all possible ished slabs and/or thin sections. As an
A primary limitation of performing image birefringence and extinction properties for example, we created a bed-by-bed library
analysis on thin sections with existing micro- a given mineral class in a training set can be containing nearly 2,000 images that chroni-
scope cameras is the FOV. In this example, difficult and time-consuming, and the end cles paleoenvironmental change through
we use a granite sample from the Golden result can be inaccurate classification (Fig. the lower Ordovician Kinblade Formation
Horn Batholith (Eddy et al., 2016) that has 3F). When multiple rotation XPL images (Fig. 4). Within a single map or section, sys-
crystals with diameters approaching 1 cm. are stacked together in the training set, each tematic image analysis can yield lithofacies
A C D E
E-G
F
B H I
G
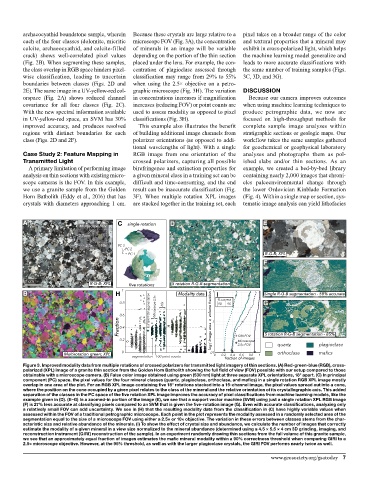
Figure 3. Improved modality data from multiple rotations of crossed polarizers for transmitted light imagery of thin sections. (A) Red-green-blue (RGB), cross-
polarized (XPL) image of a granite thin section from the Golden Horn Batholith showing the full field of view (FOV) possible with our setup compared to those
obtainable with a microscope camera. (B) False color image obtained using green (530 nm) light at three separate XPL orientations, 18° apart. (C) In principal
component (PC) space, the pixel values for the four mineral classes (quartz, plagioclase, orthoclase, and mafics) in a single rotation RGB XPL image mostly
overlap in one area of the plot. For an RGB XPL image containing five 18° rotations stacked into a 15-channel image, the pixel values spread out into a cone,
where the position on the cone occupied by a given pixel relates to the class of the mineral and the relative orientation of its crystallographic axis. This added
separation of the classes in the PC space of the five rotation XPL image improves the accuracy of pixel classifications from machine learning models, like the
example given in (D). (E–G) In a zoomed-in portion of the image (E), we see that a support vector machine (SVM) using just a single rotation XPL RGB image
(F) is 27% less accurate at classifying pixels compared to an SVM that is given the five-rotation image (G). Even with accurate classifications, analyzing only
a relatively small FOV can add uncertainty. We see in (H) that the resulting modality data from the classification in (C) have highly variable values when
assessed within the FOV of a traditional petrographic microscope. Each point in the plot represents the modality assessed in a randomly selected area of the
segmentation equal to the size of a microscope FOV using either a 2.5× or 10× objective. The variation in these errors between classes stems from the char-
acteristic size and relative abundance of the minerals. (I) To show the effect of crystal size and abundance, we calculate the number of images that correctly
estimate the modality of a given mineral in a view size normalized to the mineral abundance (determined using a 4.5 × 5.5 × 4 cm 3D grinding, imaging, and
reconstruction instrument [GIRI] reconstruction of the sample). In an experiment randomly drawing thin sections from the full volume of this granite sample,
we see that an approximately equal fraction of images estimates the mafic mineral modality within a 90% correctness threshold when comparing GIRI to a
2.5× microscope objective. However, at the 95% threshold, as well as with the larger plagioclase crystals, the GIRI FOV performs nearly twice as well.
www.geosociety.org/gsatoday 7